ECS Server HA Failure Domain Testing
- 1. Introduction to the test environment
- 2. Basic Concept
- 3. Case #1. An ECS Server is unreachable
- 4. Case #2. An ECS Agent is unreachable
- 5. Conclusion
1. Introduction to the test environment
| CDP Runtime version | CDP PvC Base 7.1.7 SP1 |
| CM version | Cloudera Manager 7.8.1 |
| ECS version | CDP PvC DataServices 1.4.1 |
| OS version | Centos 7.9 |
| K8S version | RKE 1.21 |
| Whether to enable Kerberos | Yes |
| Whether to enable TLS | Yes |
| Auto-TLS | Yes |
| Kerberos | FreeIPA |
| LDAP | FreeIPA |
| DB Configuration | External Postgres 12 |
| Vault | Embedded |
| Docker registry | Embedded |
| Install Method | Internet |
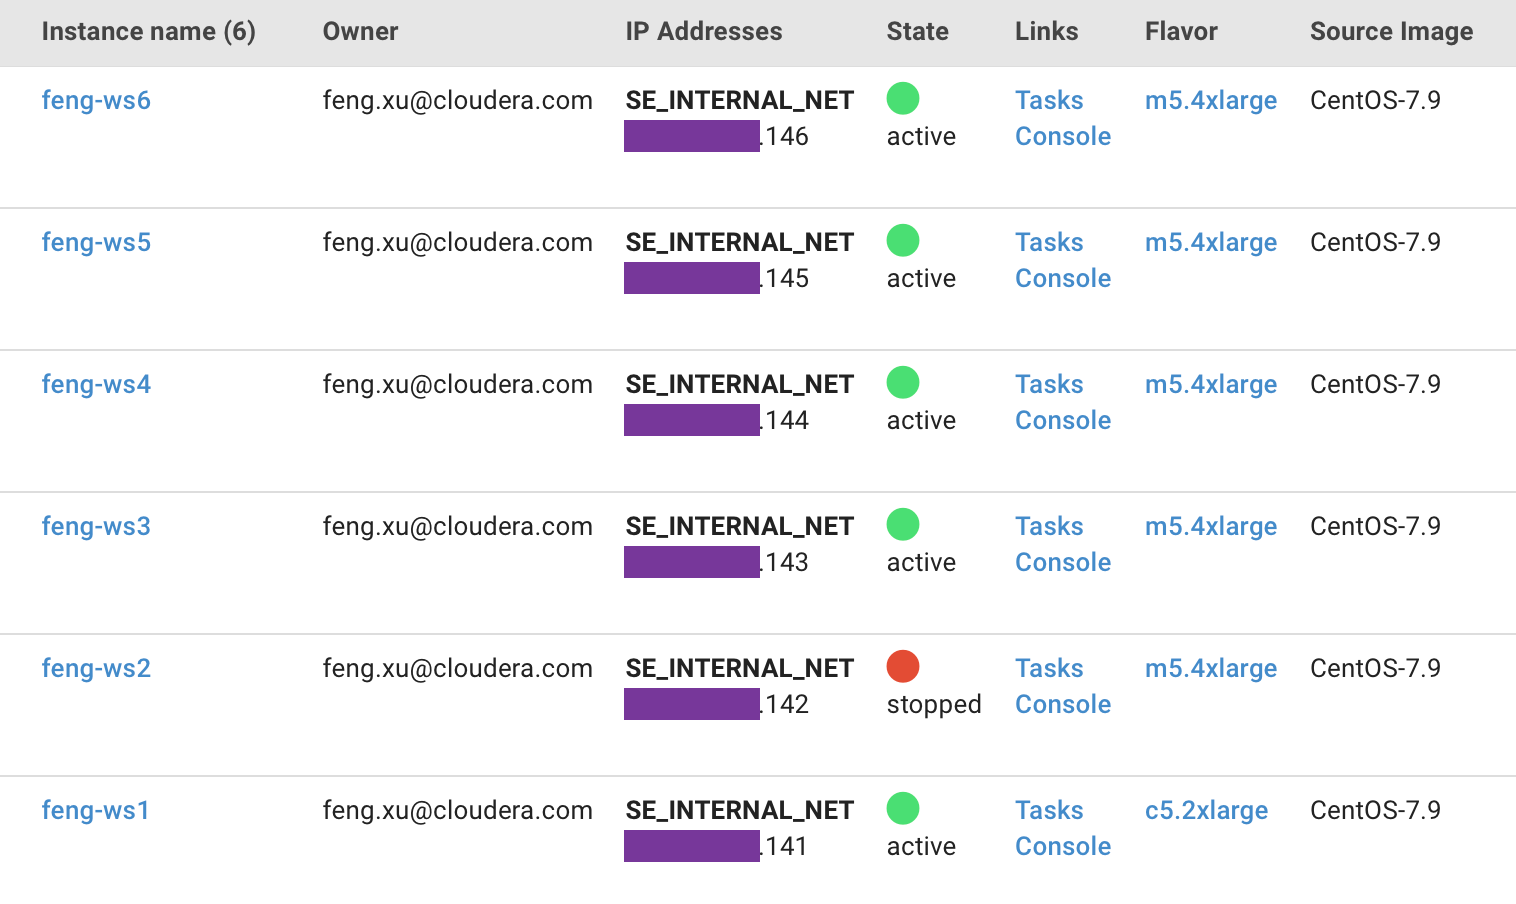
| IP addresss | hostname | description |
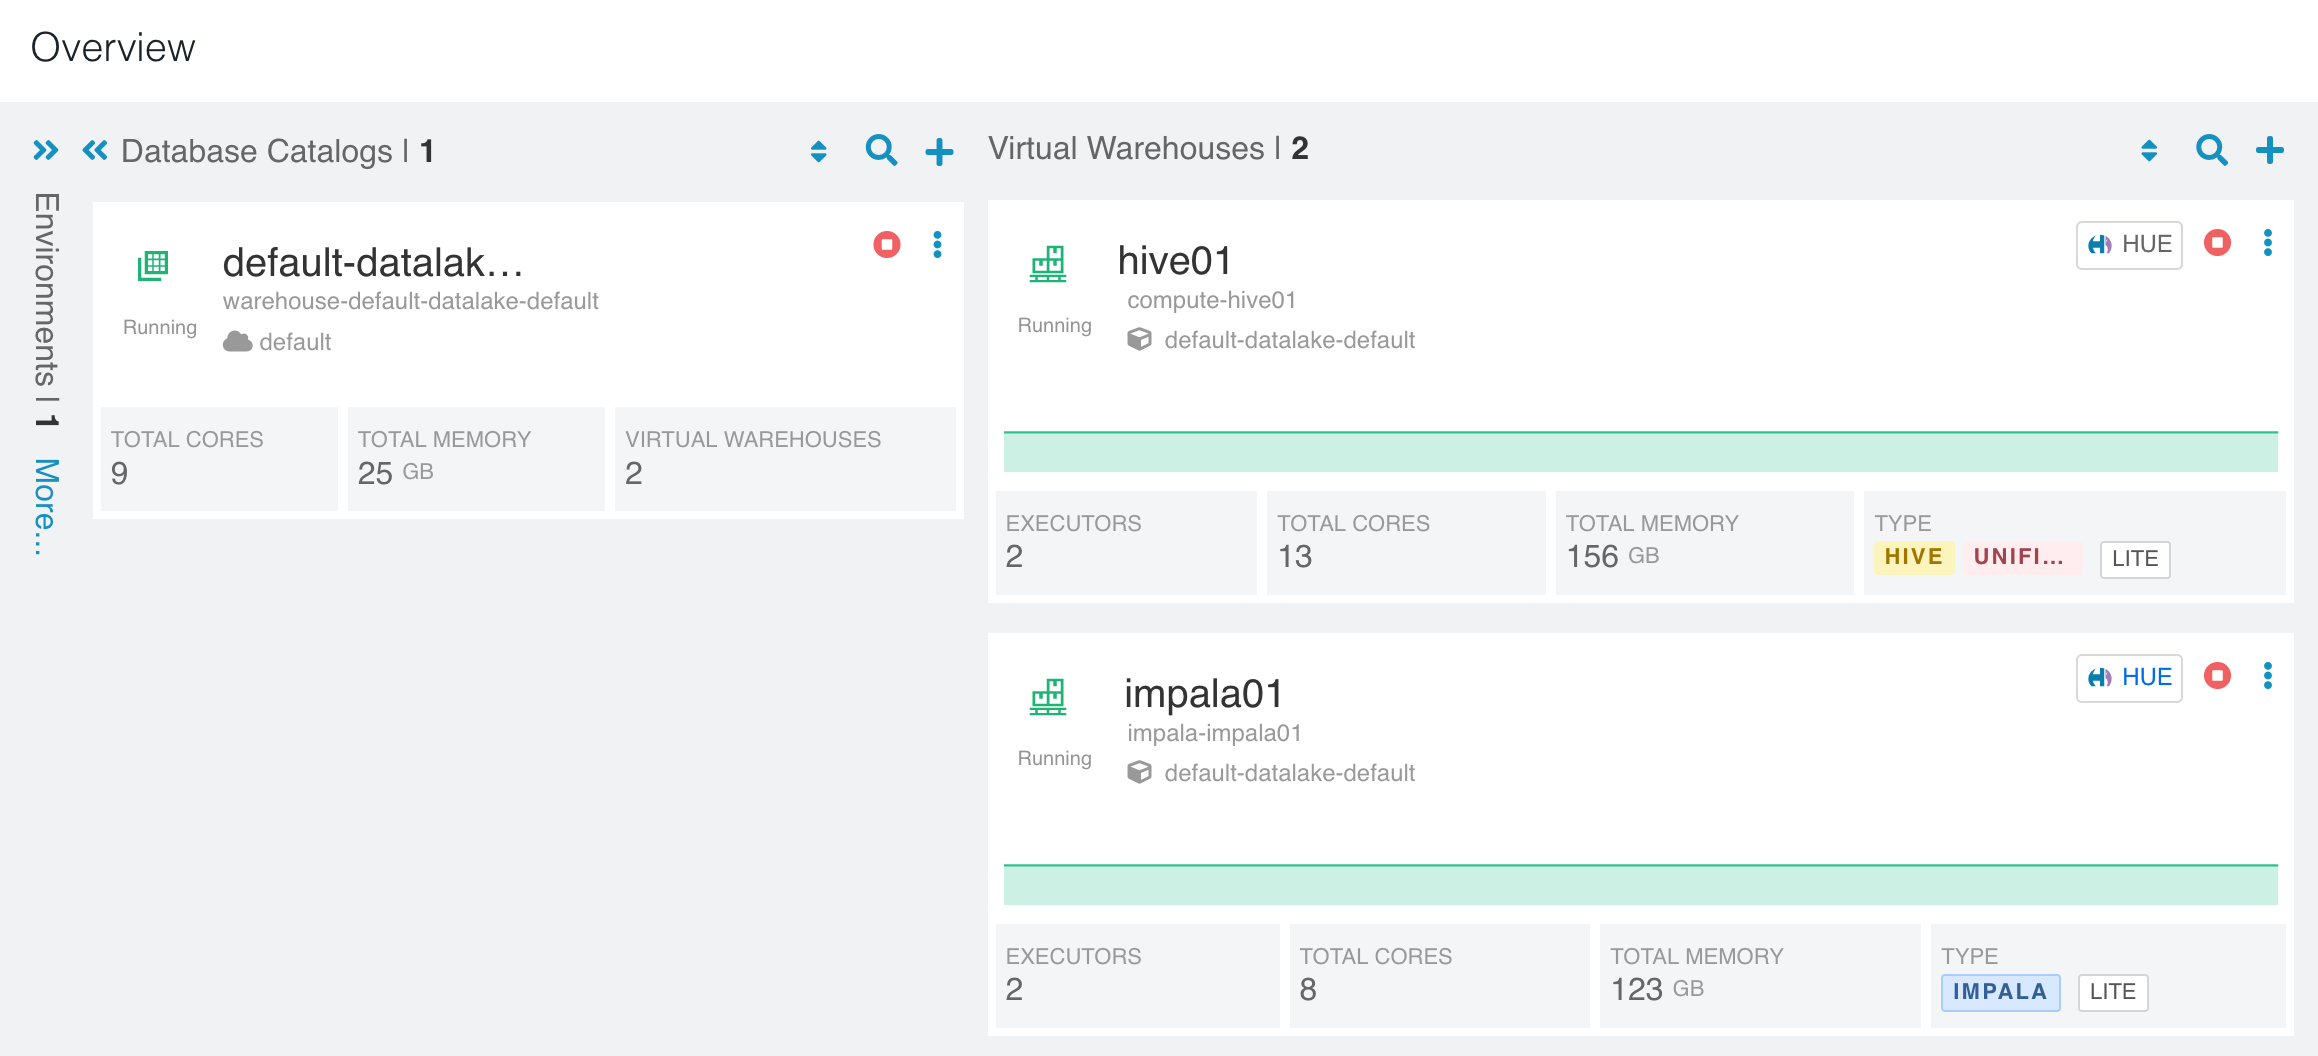
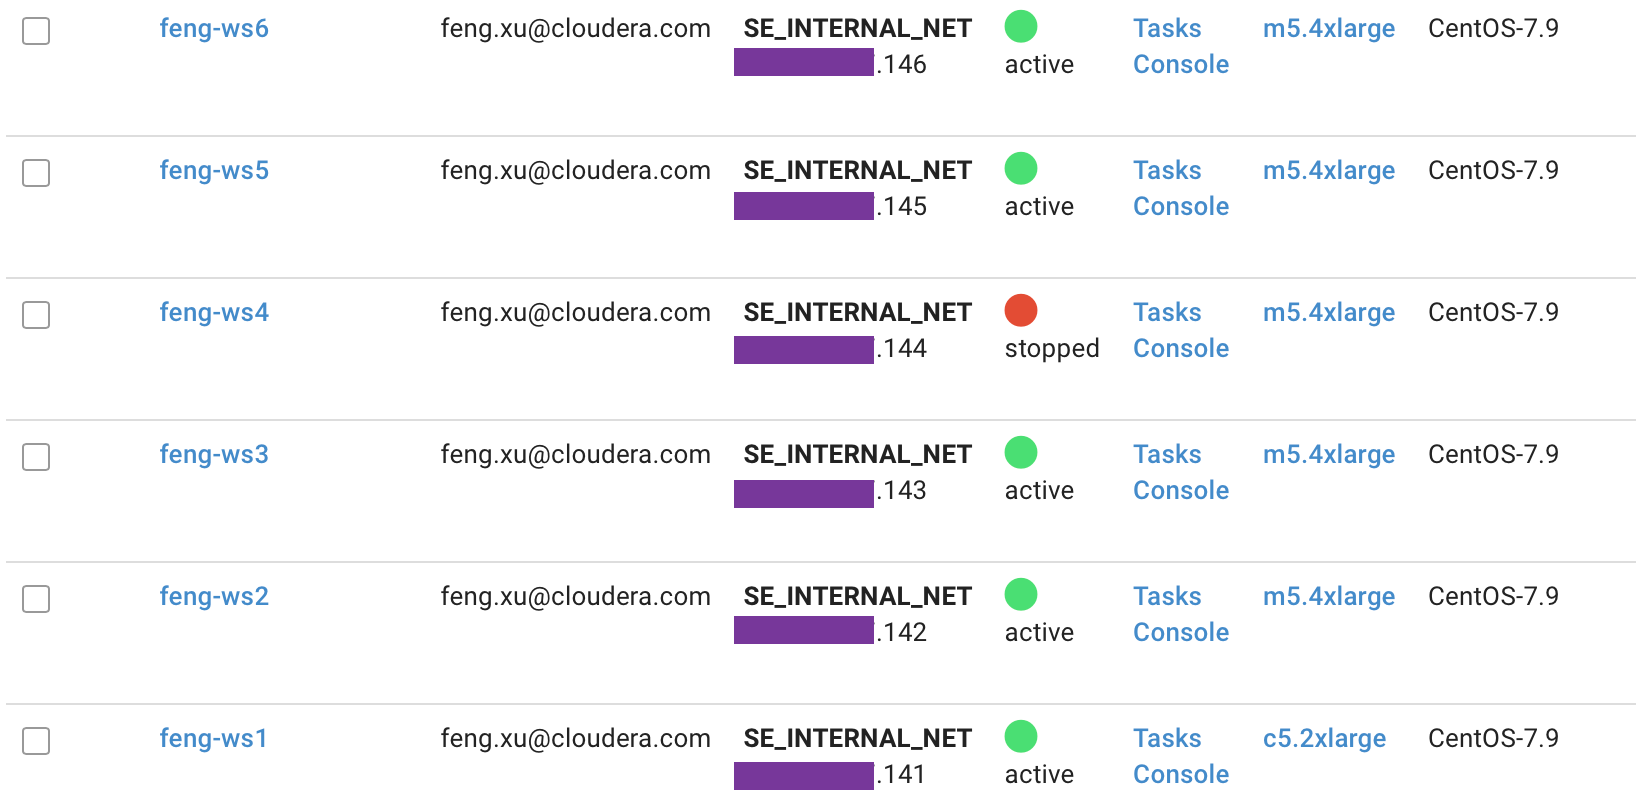
| 192.168.8.141 | ds01.ecs.openstack.com | ECS master node 1 |
| 192.168.8.142 | ds02.ecs.openstack.com | ECS master node 2 |
| 192.168.8.143 | ds03.ecs.openstack.com | ECS master node 3 |
| 192.168.8.144 | ds04.ecs.openstack.com | ECS worker node 1 |
| 192.168.8.145 | ds05.ecs.openstack.com | ECS worker node 2 |
| 192.168.8.146 | ds06.ecs.openstack.com | ECS worker node 3 |
- For ECS cluster install/config guide, see Fresh install of ECS 1.3.4 HA Cluster.
2. Basic Concept
2.1 Pod Eviction on the NotReady Node
- kube-controller-manager checks the node status periodically. Whenever the node status is NotReady and the podEvictionTimeout time is exceeded, all pods on the node will be expelled to other nodes. The specific expulsion speed is also affected by expulsion speed parameters, cluster size, and so on. See kubernetes pod evictions.
2.2 Pod Deletion on the NotReady Node
A Pod is not deleted automatically when a node is unreachable. The Pods running on an unreachable Node enter the ‘Terminating’ or ‘Unknown’ state after a timeout. Pods may also enter these states when the user attempts graceful deletion of a Pod on an unreachable Node. See delete pods.
- The only ways in which a Pod in such a state can be removed from the apiserver are as follows:
- The Node object is deleted (either by you, or by the Node Controller).
- The kubelet on the unresponsive Node starts responding, kills the Pod and removes the entry from the apiserver.
- Force deletion of the Pod by the user.
The recommended best practice is to use the first or second approach. If a Node is confirmed to be dead (e.g. permanently disconnected from the network, powered down, etc), then delete the Node object. If the Node is suffering from a network partition, then try to resolve this or wait for it to resolve. When the partition heals, the kubelet will complete the deletion of the Pod and free up its name in the apiserver.
- Normally, the system completes the deletion once the Pod is no longer running on a Node, or the Node is deleted by an administrator. You may override this by force deleting the Pod.
2.3 Safely Drain a Node before you bring down the node
- You can use kubectl drain to safely evict all of your pods from a node before you perform maintenance on the node (e.g. kernel upgrade, hardware maintenance, etc.). Safe evictions allow the pod’s containers to gracefully terminate and will respect the PodDisruptionBudgets you have specified. See use kubectl drain to remove a node from service.
- When kubectl drain returns successfully, that indicates that all of the pods (except the ones excluded as described in the previous paragraph) have been safely evicted (respecting the desired graceful termination period, and respecting the PodDisruptionBudget you have defined). It is then safe to bring down the node by powering down its physical machine or, if running on a cloud platform, deleting its virtual machine.
2.4 Cronjob pod-reaper introduced in PvC 1.4.1
- CronJob pod-reaper launched reaper job every 10 minutes. The reaper job will scan all namespaces and force deleting pods that have been in the terminating state for more than 10 minutes.
3. Case #1. An ECS Server is unreachable
- Check all ECS nodes
$ kubectl get node
NAME                                    STATUS   ROLES                       AGE    VERSION
ds01.ecs.openstack.com   Ready    control-plane,etcd,master   2d4h   v1.21.14+rke2r1
ds02.ecs.openstack.com   Ready    control-plane,etcd,master   2d4h   v1.21.14+rke2r1
ds03.ecs.openstack.com   Ready    control-plane,etcd,master   2d4h   v1.21.14+rke2r1
ds04.ecs.openstack.com   Ready    <none>                      2d4h   v1.21.14+rke2r1
ds05.ecs.openstack.com   Ready    <none>                      2d4h   v1.21.14+rke2r1
ds06.ecs.openstack.com   Ready    <none>                      2d4h   v1.21.14+rke2r1
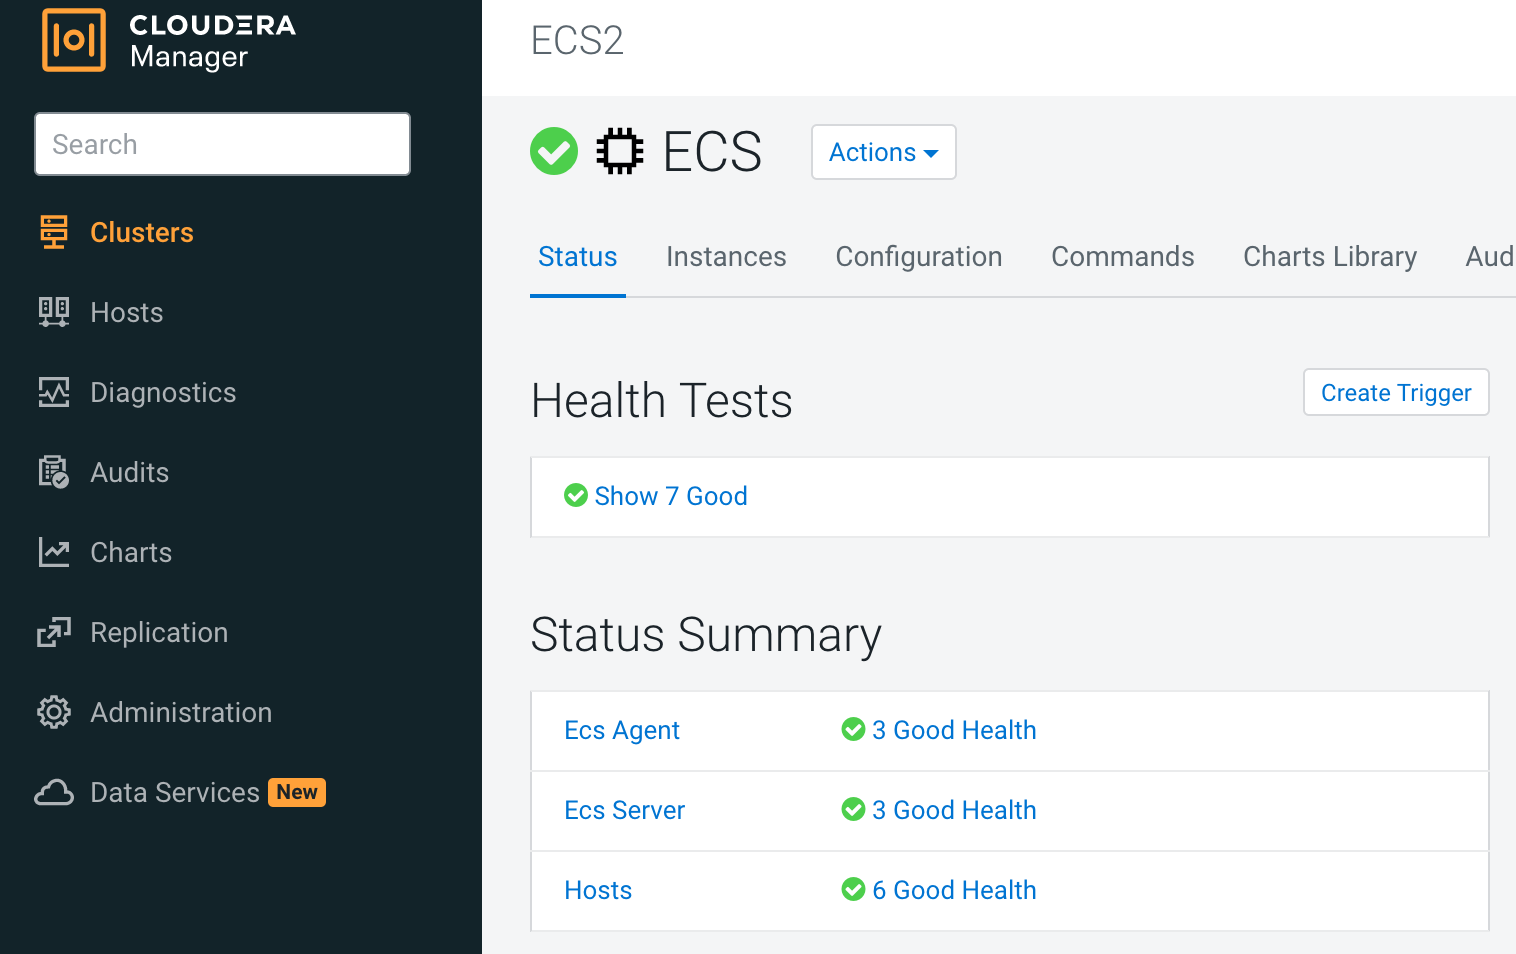
- Check the state of ECS roles on CM UI
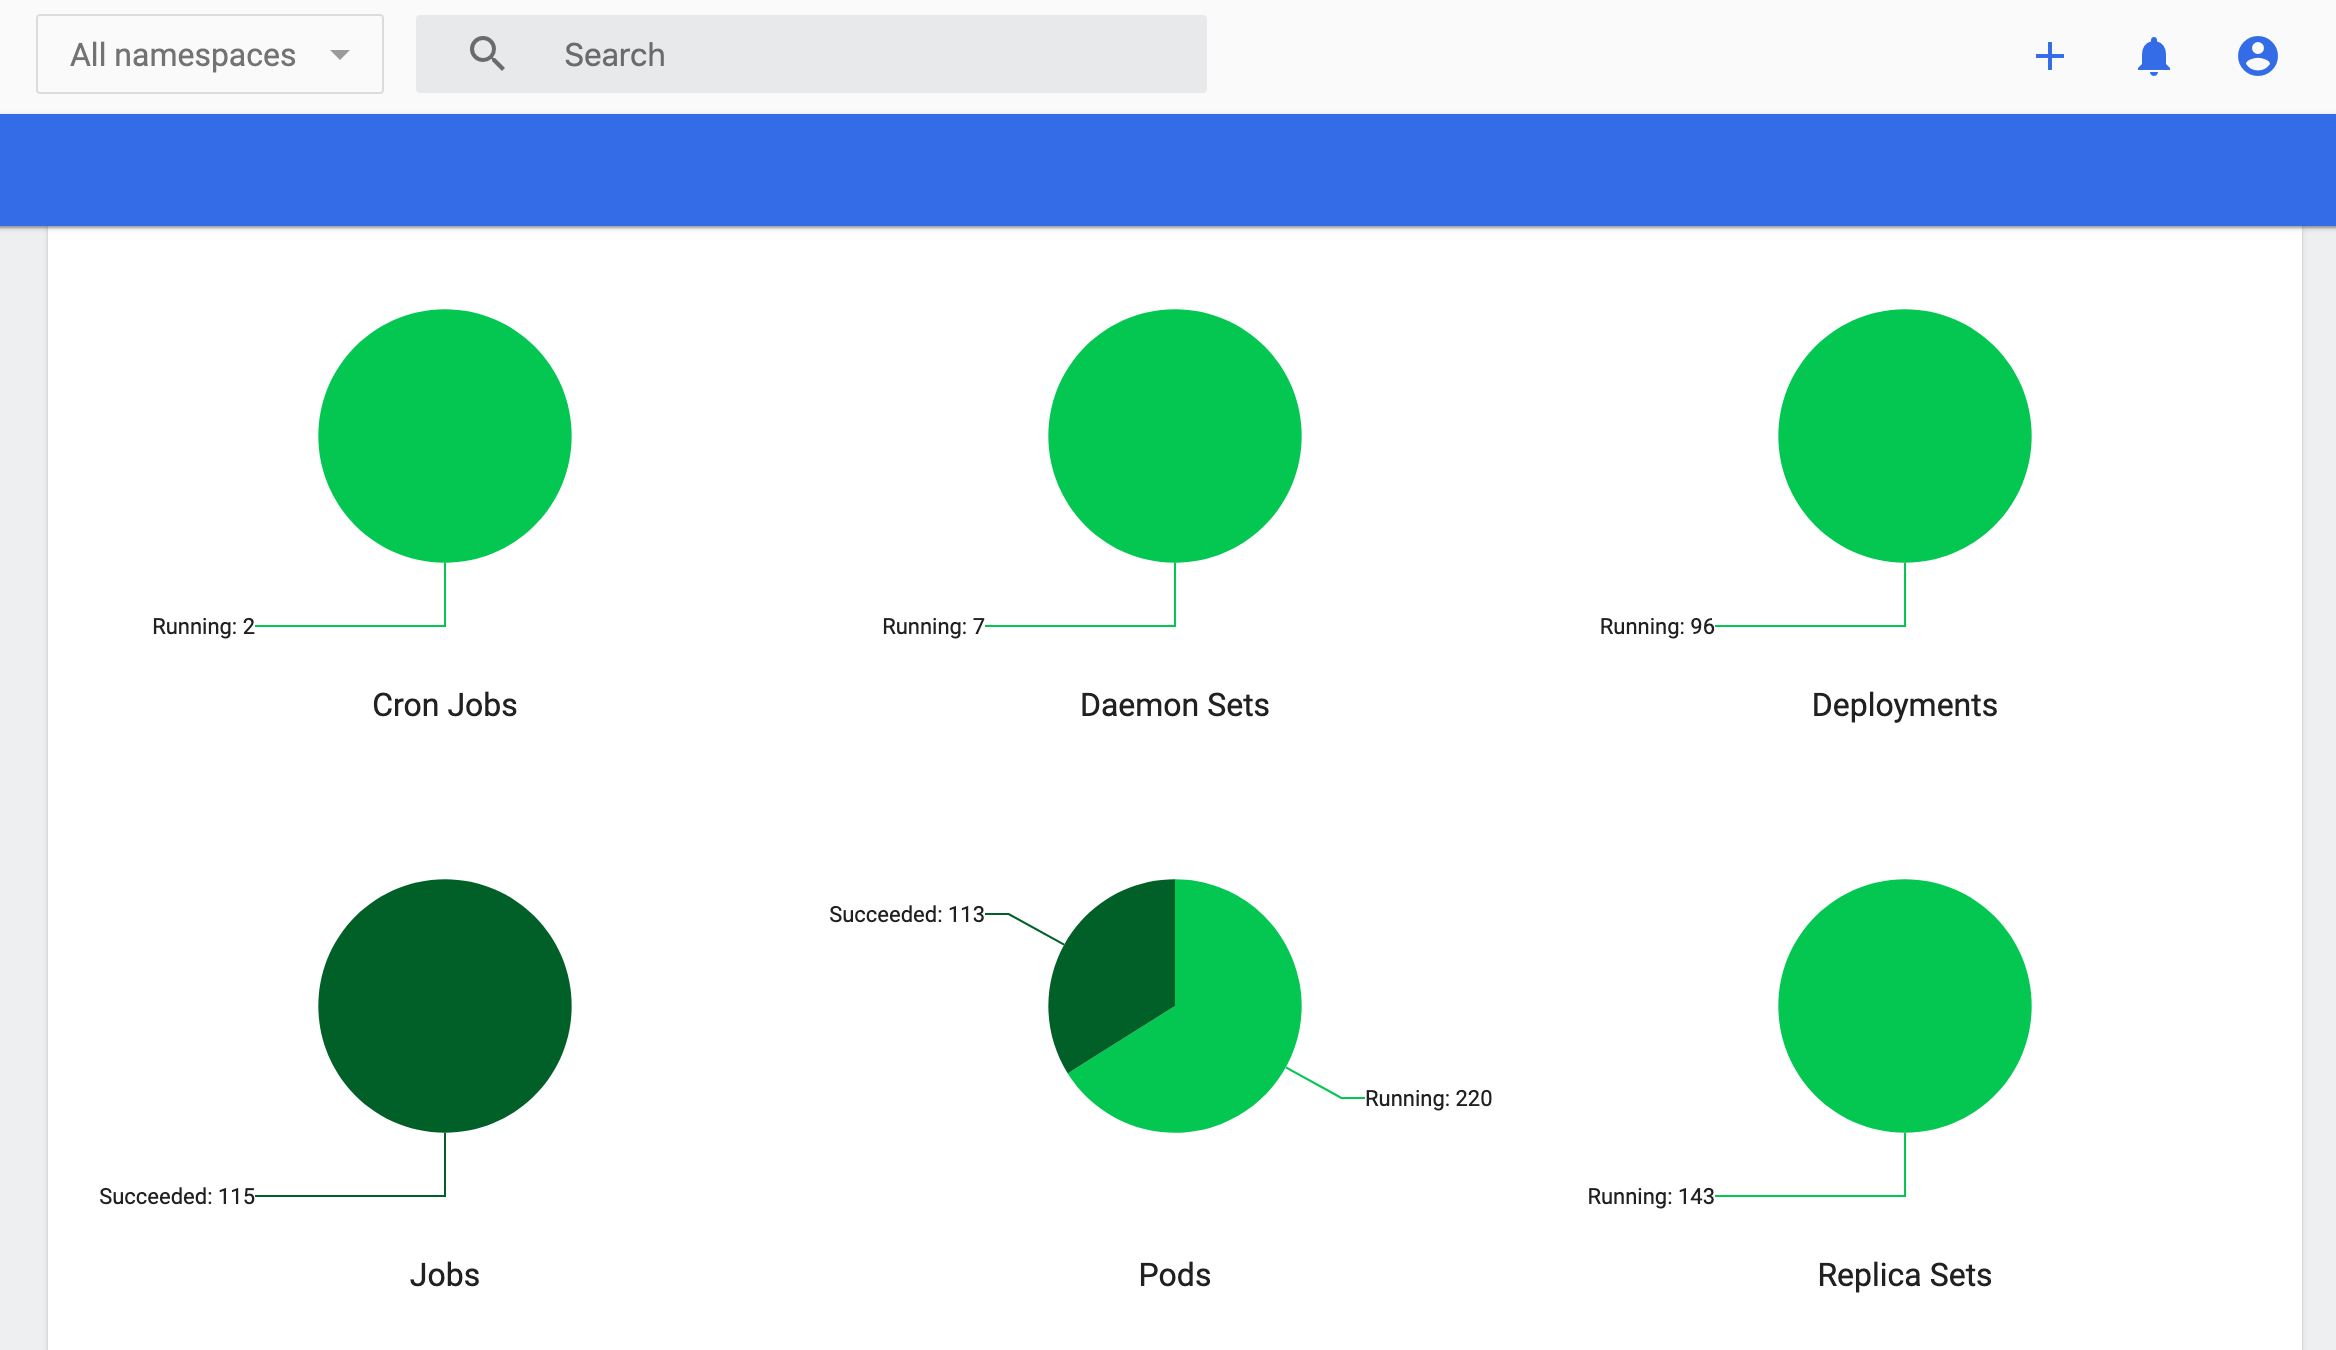
- Check all Kubernetes objects
- Check all pods running on ds02
$ kubectl get pods -A -o wide --field-selector spec.nodeName=ds02.ecs.openstack.com
NAMESPACE                            NAME                                                              READY   STATUS      RESTARTS   AGE     IP               NODE                                    NOMINATED NODE   READINESS GATES
cdp                                  cdp-release-alert-admin-service-68f5c6dd7c-glt9k                  2/2     Running     0          2d4h    10.42.1.17       ds02.ecs.openstack.com   <none>           <none>
cdp                                  cdp-release-classic-clusters-7fdf69b6b-psmkj                      3/3     Running     0          2d4h    10.42.1.24       ds02.ecs.openstack.com   <none>           <none>
cdp                                  cdp-release-cluster-access-manager-b58448f45-hqpnq                2/2     Running     0          2d4h    10.42.1.26       ds02.ecs.openstack.com   <none>           <none>
cdp                                  cdp-release-dmx-559ccfb675-qjqb5                                  3/3     Running     0          2d4h    10.42.1.21       ds02.ecs.openstack.com   <none>           <none>
cdp                                  cdp-release-logger-alert-receiver-7cc7647d57-r78s4                2/2     Running     0          2d4h    10.42.1.19       ds02.ecs.openstack.com   <none>           <none>
cdp                                  cdp-release-metrics-server-exporter-cfff8b89f-tm7gs               2/2     Running     0          2d4h    10.42.1.18       ds02.ecs.openstack.com   <none>           <none>
cdp                                  cdp-release-thunderhead-de-api-675b74d89c-hl4h7                   2/2     Running     0          2d4h    10.42.1.15       ds02.ecs.openstack.com   <none>           <none>
cml01                                api-648d7bc885-xvv92                                              1/1     Running     1          105m    10.42.1.48       ds02.ecs.openstack.com   <none>           <none>
cml01                                cron-86888f4849-gn2kw                                             2/2     Running     0          105m    10.42.1.44       ds02.ecs.openstack.com   <none>           <none>
cml01                                ds-operator-5d79bf6756-k78kk                                      2/2     Running     0          105m    10.42.1.46       ds02.ecs.openstack.com   <none>           <none>
cml01                                ds-reconciler-5bfb4bb4fc-qgbrz                                    2/2     Running     0          105m    10.42.1.45       ds02.ecs.openstack.com   <none>           <none>
cml01                                livelog-0                                                         2/2     Running     0          104m    10.42.1.49       ds02.ecs.openstack.com   <none>           <none>
cml01                                livelog-publisher-5wjw5                                           2/2     Running     2          2d2h    10.42.1.34       ds02.ecs.openstack.com   <none>           <none>
cml01                                model-metrics-7654cf6945-7vsbm                                    1/1     Running     0          105m    10.42.1.47       ds02.ecs.openstack.com   <none>           <none>
cml01                                model-proxy-dd4d49678-tqj4h                                       2/2     Running     0          105m    10.42.1.43       ds02.ecs.openstack.com   <none>           <none>
cml01                                s2i-queue-0                                                       2/2     Running     0          2d2h    10.42.1.35       ds02.ecs.openstack.com   <none>           <none>
compute-hive01                       hiveserver2-0                                                     1/1     Running     0          2m38s   10.42.1.53       ds02.ecs.openstack.com   <none>           <none>
compute-hive01                       huebackend-0                                                      1/1     Running     0          2m38s   10.42.1.52       ds02.ecs.openstack.com   <none>           <none>
compute-hive01                       huefrontend-5b67b68994-vqcp8                                      1/1     Running     0          2m38s   10.42.1.51       ds02.ecs.openstack.com   <none>           <none>
compute-hive01                       standalone-compute-operator-0                                     1/1     Running     0          2m39s   10.42.1.50       ds02.ecs.openstack.com   <none>           <none>
ecs-webhooks                         ecs-tolerations-webhook-7d9454f4f9-549qj                          1/1     Running     0          2d4h    10.42.1.3        ds02.ecs.openstack.com   <none>           <none>
impala-impala01                      catalogd-0                                                        2/2     Running     1          30h     10.42.1.39       ds02.ecs.openstack.com   <none>           <none>
impala-impala01                      huebackend-0                                                      2/2     Running     0          30h     10.42.1.37       ds02.ecs.openstack.com   <none>           <none>
impala-impala01                      huefrontend-7788ff9f45-8kvhj                                      1/1     Running     0          30h     10.42.1.36       ds02.ecs.openstack.com   <none>           <none>
impala-impala01                      impala-autoscaler-66cfbb7b7f-clsfg                                1/1     Running     0          30h     10.42.1.38       ds02.ecs.openstack.com   <none>           <none>
impala-impala01                      statestored-8bcbc5657-mw7kg                                       1/1     Running     0          30h     10.42.1.41       ds02.ecs.openstack.com   <none>           <none>
impala-impala01                      usage-monitor-645b96b78f-fvvvp                                    1/1     Running     0          30h     10.42.1.40       ds02.ecs.openstack.com   <none>           <none>
infra-prometheus                     infra-prometheus-operator-1-1672115985-prometheus-node-exp49m48   1/1     Running     0          2d4h    192.168.8.142   ds02.ecs.openstack.com   <none>           <none>
kube-system                          etcd-ds02.ecs.openstack.com                        1/1     Running     0          2d4h    192.168.8.142   ds02.ecs.openstack.com   <none>           <none>
kube-system                          helm-install-rke2-canal-xt5w6                                     0/1     Completed   0          2d4h    192.168.8.142   ds02.ecs.openstack.com   <none>           <none>
kube-system                          kube-apiserver-ds02.ecs.openstack.com              1/1     Running     0          2d4h    192.168.8.142   ds02.ecs.openstack.com   <none>           <none>
kube-system                          kube-controller-manager-ds02.ecs.openstack.com     1/1     Running     0          2d4h    192.168.8.142   ds02.ecs.openstack.com   <none>           <none>
kube-system                          kube-proxy-ds02.ecs.openstack.com                  1/1     Running     0          2d4h    192.168.8.142   ds02.ecs.openstack.com   <none>           <none>
kube-system                          kube-scheduler-ds02.ecs.openstack.com              1/1     Running     0          2d4h    192.168.8.142   ds02.ecs.openstack.com   <none>           <none>
kube-system                          nvidia-device-plugin-daemonset-vfvm9                              1/1     Running     0          2d4h    10.42.1.14       ds02.ecs.openstack.com   <none>           <none>
kube-system                          rke2-canal-jgslr                                                  2/2     Running     0          2d4h    192.168.8.142   ds02.ecs.openstack.com   <none>           <none>
kube-system                          rke2-coredns-rke2-coredns-6775f768c8-82tkq                        1/1     Running     0          2d4h    10.42.1.2        ds02.ecs.openstack.com   <none>           <none>
kube-system                          rke2-ingress-nginx-controller-84fb589c78-bgkp5                    1/1     Running     0          2d4h    10.42.1.13       ds02.ecs.openstack.com   <none>           <none>
longhorn-system                      engine-image-ei-045573ad-thvcf                                    1/1     Running     0          2d4h    10.42.1.11       ds02.ecs.openstack.com   <none>           <none>
longhorn-system                      helm-install-longhorn-z7hr8                                       0/1     Completed   0          2d4h    10.42.1.4        ds02.ecs.openstack.com   <none>           <none>
longhorn-system                      instance-manager-e-b4025e6d                                       1/1     Running     0          2d4h    10.42.1.10       ds02.ecs.openstack.com   <none>           <none>
longhorn-system                      instance-manager-r-dfa1437e                                       1/1     Running     0          2d4h    10.42.1.9        ds02.ecs.openstack.com   <none>           <none>
longhorn-system                      longhorn-admission-webhook-584567fd57-sfmmg                       1/1     Running     0          2d4h    10.42.1.8        ds02.ecs.openstack.com   <none>           <none>
longhorn-system                      longhorn-conversion-webhook-74bdb64887-mq45q                      1/1     Running     0          2d4h    10.42.1.5        ds02.ecs.openstack.com   <none>           <none>
longhorn-system                      longhorn-csi-plugin-p24j8                                         2/2     Running     0          2d4h    10.42.1.12       ds02.ecs.openstack.com   <none>           <none>
longhorn-system                      longhorn-manager-h2vb2                                            1/1     Running     0          2d4h    10.42.1.6        ds02.ecs.openstack.com   <none>           <none>
longhorn-system                      longhorn-ui-6f94dfc58c-jw7r8                                      1/1     Running     0          2d4h    10.42.1.7        ds02.ecs.openstack.com   <none>           <none>
warehouse-default-datalake-default   metastore-0                                                       1/1     Running     0          2d3h    10.42.1.27       ds02.ecs.openstack.com   <none>           <none>
- Shutdown node ds02
- Confirm that only ds02 is NotReady
$ kubectl get node
NAME                                    STATUS     ROLES                       AGE    VERSION
ds01.ecs.openstack.com   Ready      control-plane,etcd,master   2d4h   v1.21.14+rke2r1
ds02.ecs.openstack.com   NotReady   control-plane,etcd,master   2d4h   v1.21.14+rke2r1
ds03.ecs.openstack.com   Ready      control-plane,etcd,master   2d4h   v1.21.14+rke2r1
ds04.ecs.openstack.com   Ready      <none>                      2d4h   v1.21.14+rke2r1
ds05.ecs.openstack.com   Ready      <none>                      2d4h   v1.21.14+rke2r1
ds06.ecs.openstack.com   Ready      <none>                      2d4h   v1.21.14+rke2r1
- ECS server (ds02, ds03) stderr.log indicated Stopped tunnel to 192.168.8.142.
time="2022-12-29T17:13:37+08:00" level=info msg="error in remotedialer server [400]: websocket: close 1006 (abnormal closure): unexpected EOF"
time="2022-12-29T17:13:37+08:00" level=error msg="Remotedialer proxy error" error="websocket: close 1006 (abnormal closure): unexpected EOF"
time="2022-12-29T17:13:42+08:00" level=info msg="Connecting to proxy" url="wss://192.168.8.142:9345/v1-rke2/connect"
time="2022-12-29T17:13:53+08:00" level=info msg="Stopped tunnel to 192.168.8.142:9345"
time="2022-12-29T17:14:47+08:00" level=error msg="Failed to connect to proxy" error="dial tcp 192.168.8.142:9345: connect: no route to host"
time="2022-12-29T17:14:47+08:00" level=error msg="Remotedialer proxy error" error="dial tcp 192.168.8.142:9345: connect: no route to host"
- ECS Agent (ds04, ds05, ds06 ) stderr.log indicated Updating load balancer server addresses and Stopped tunnel to 192.168.8.142.
time="2022-12-29T17:13:37+08:00" level=error msg="Remotedialer proxy error" error="websocket: close 1006 (abnormal closure): unexpected EOF"
time="2022-12-29T17:13:42+08:00" level=info msg="Connecting to proxy" url="wss://192.168.8.142:9345/v1-rke2/connect"
time="2022-12-29T17:14:08+08:00" level=error msg="Tunnel endpoint watch channel closed: {ERROR &Status{ListMeta:ListMeta{SelfLink:,ResourceVersion:,Continue:,RemainingItemCount:nil,},Status:Failure,Message:an error on the server (\"unable to decode an event from the watch stream: http2: client connection lost\") has prevented the request from succeeding,Reason:InternalError,Details:&StatusDetails{Name:,Group:,Kind:,Causes:[]StatusCause{StatusCause{Type:UnexpectedServerResponse,Message:unable to decode an event from the watch stream: http2: client connection lost,Field:,},StatusCause{Type:ClientWatchDecoding,Message:unable to decode an event from the watch stream: http2: client connection lost,Field:,},},RetryAfterSeconds:0,UID:,},Code:500,}}"
time="2022-12-29T17:14:13+08:00" level=info msg="Updating load balancer rke2-api-server-agent-load-balancer server addresses -> [192.168.8.141:6443 192.168.8.143:6443 192.168.8.142:6443]"
time="2022-12-29T17:14:13+08:00" level=info msg="Updating load balancer rke2-agent-load-balancer server addresses -> [192.168.8.141:9345 192.168.8.143:9345]"
time="2022-12-29T17:14:13+08:00" level=info msg="Stopped tunnel to 192.168.8.142:9345"
time="2022-12-29T17:14:45+08:00" level=error msg="Failed to connect to proxy" error="dial tcp 192.168.8.142:9345: connect: no route to host"
time="2022-12-29T17:14:45+08:00" level=error msg="Remotedialer proxy error" error="dial tcp 192.168.8.142:9345: connect: no route to host"
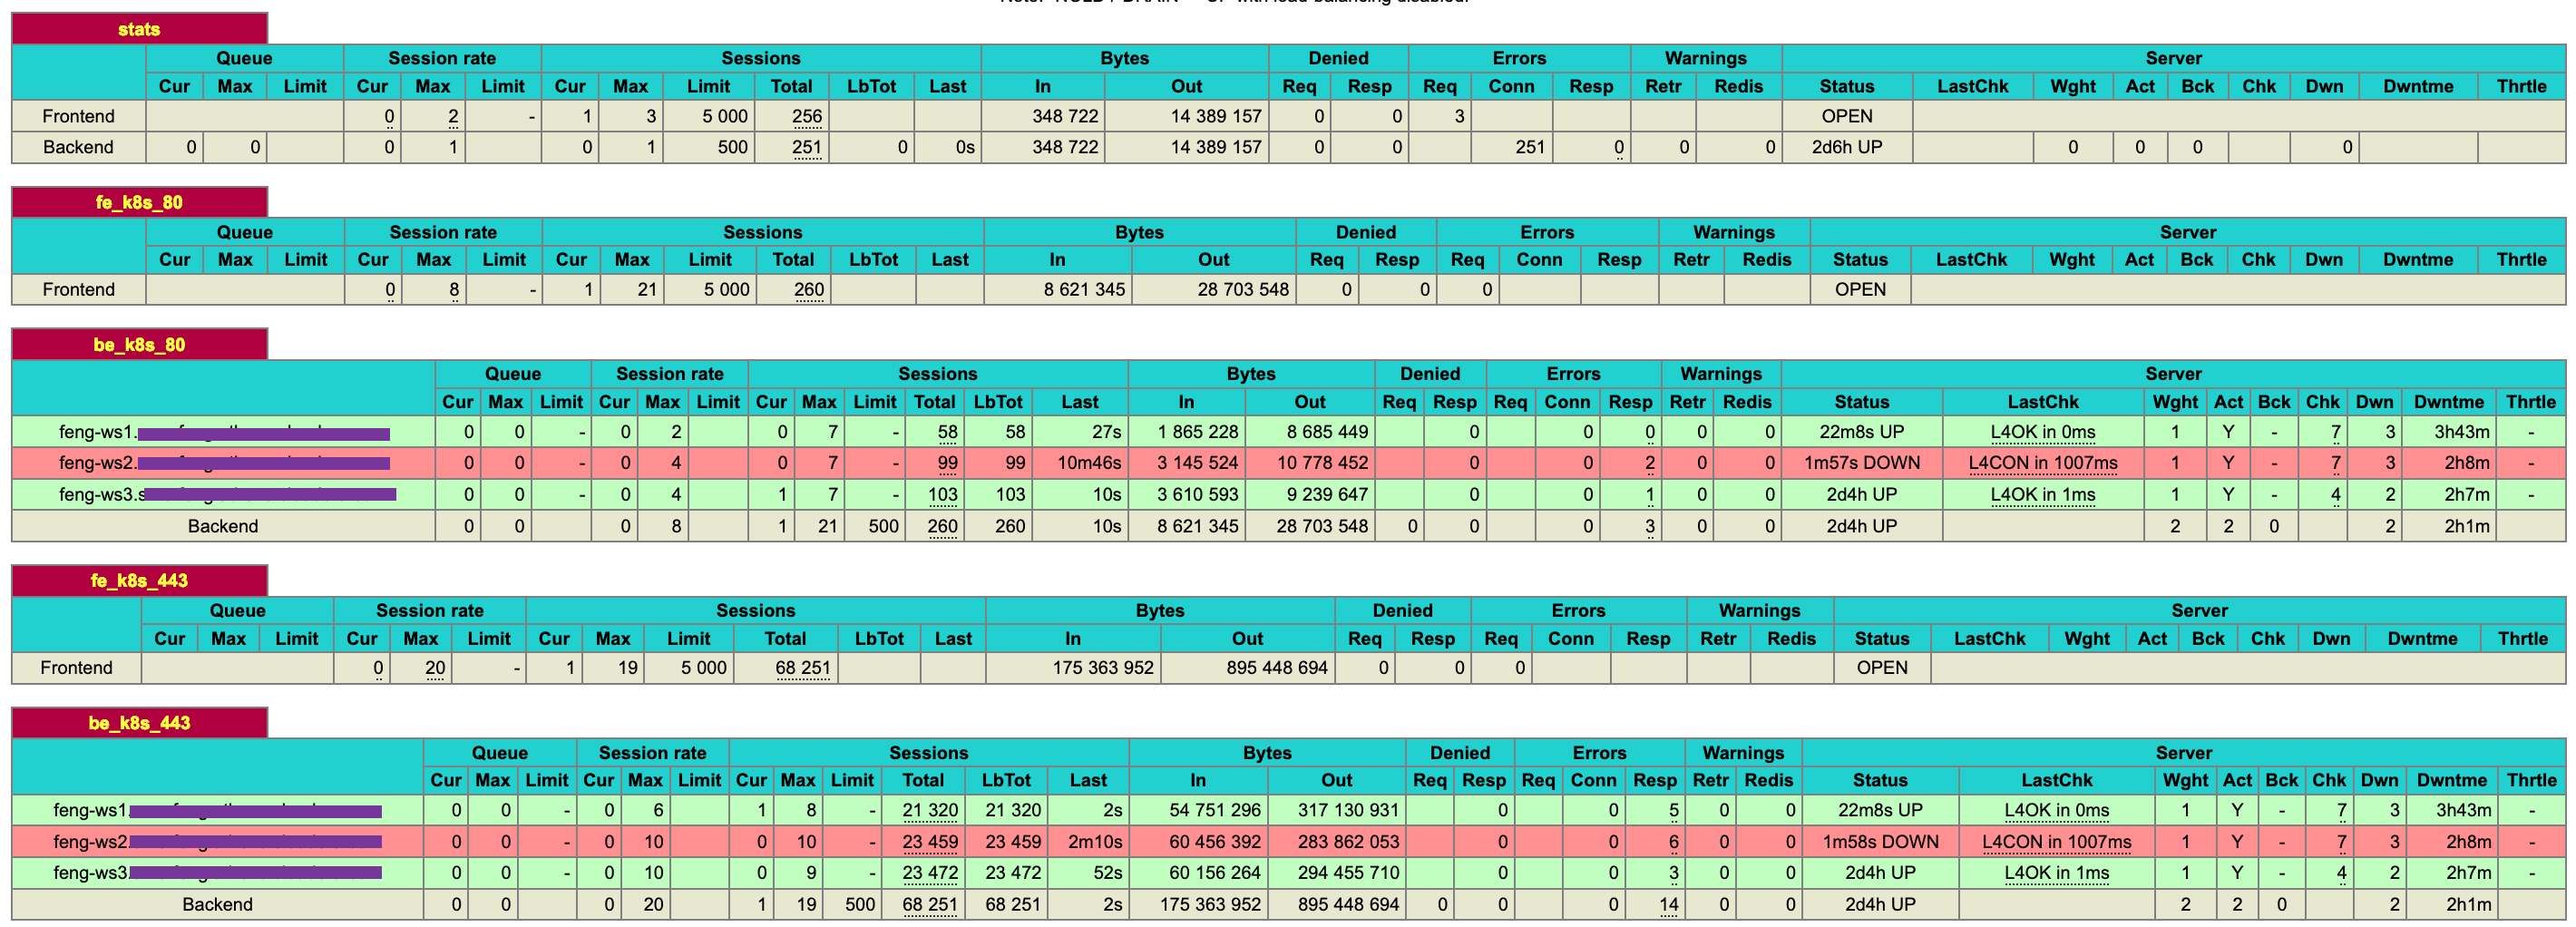
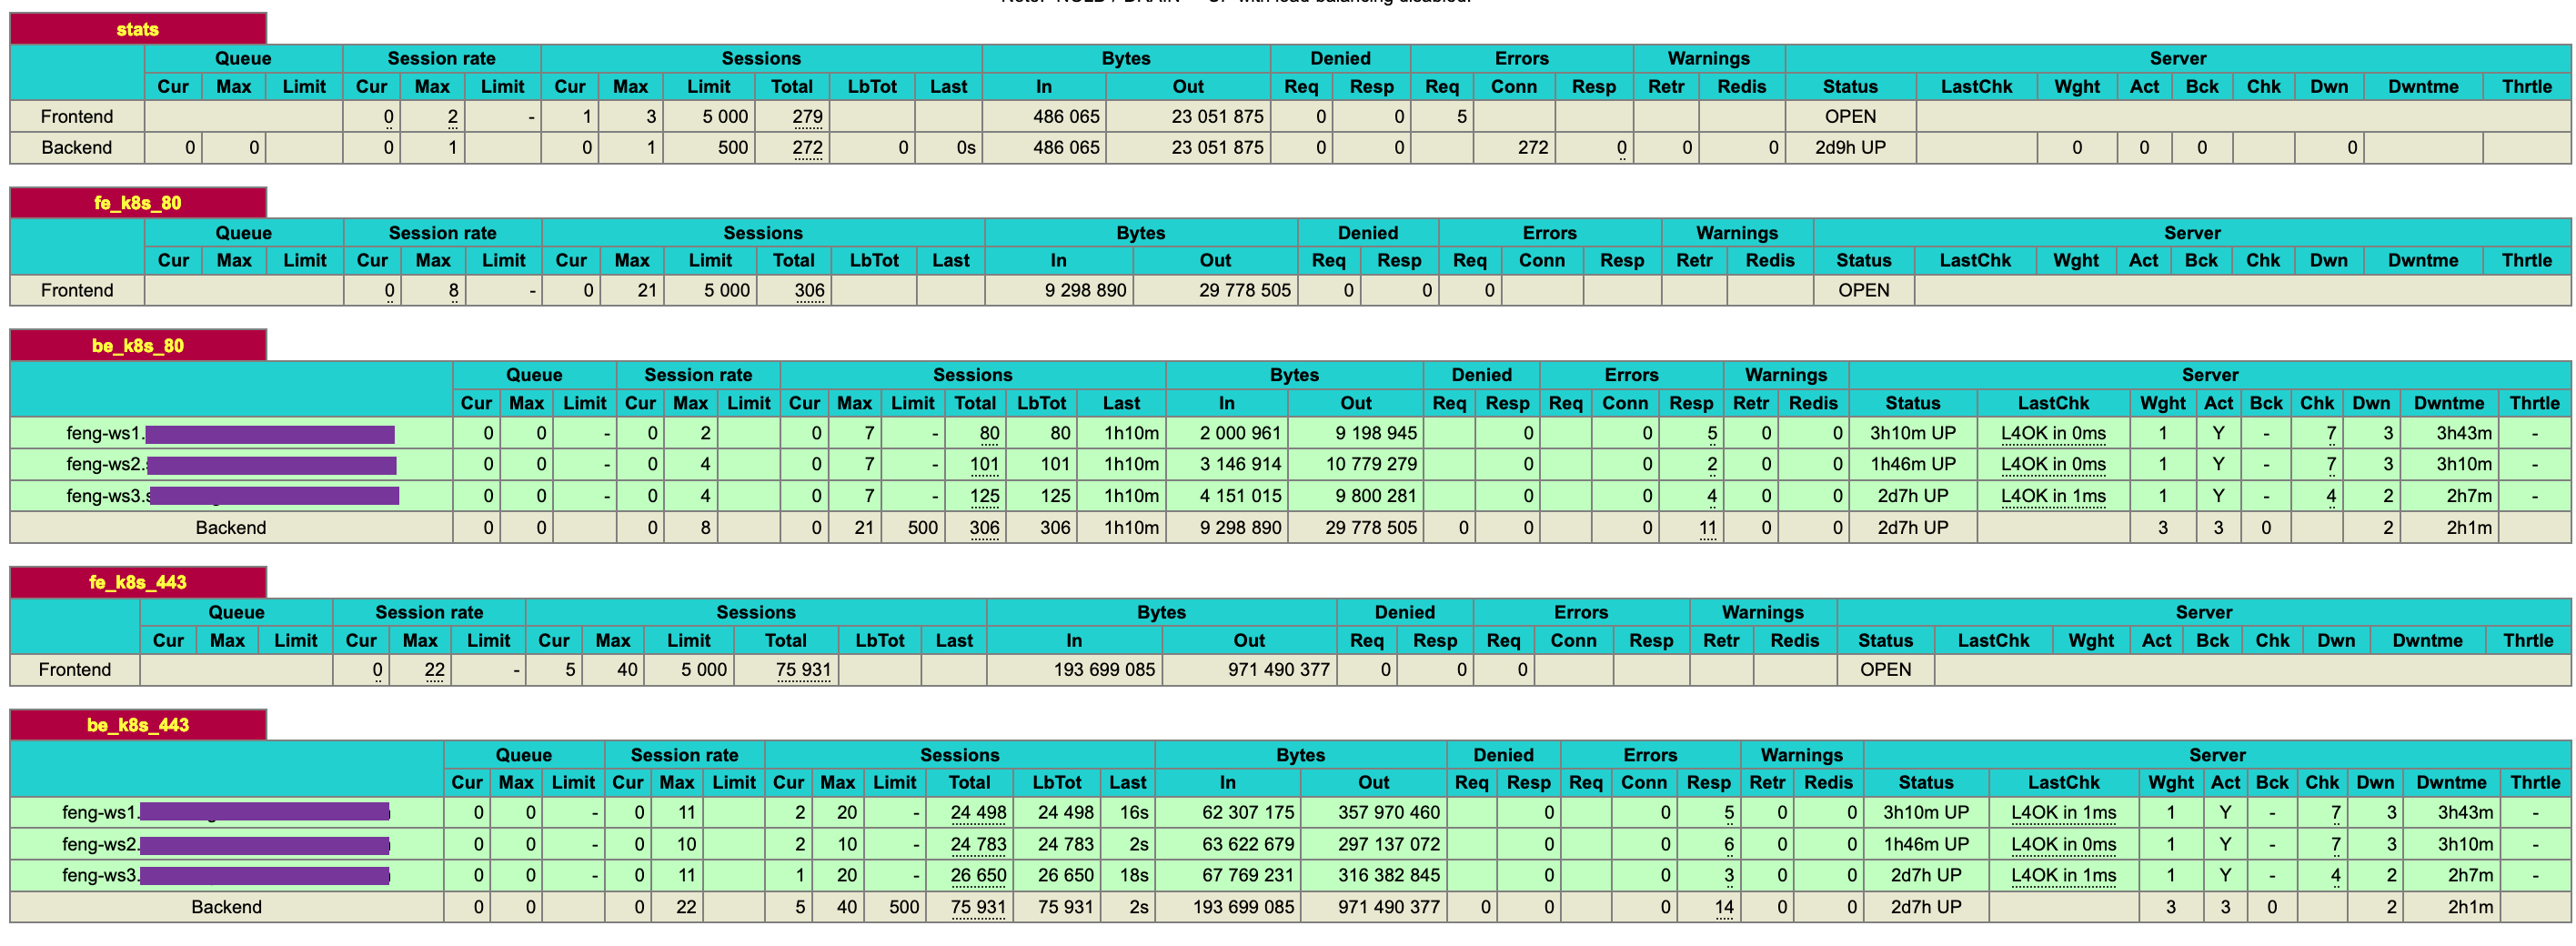
- As you can see from the HAProxy UI, all ports on ds02 ( http port 80, https port 434) have become Down state
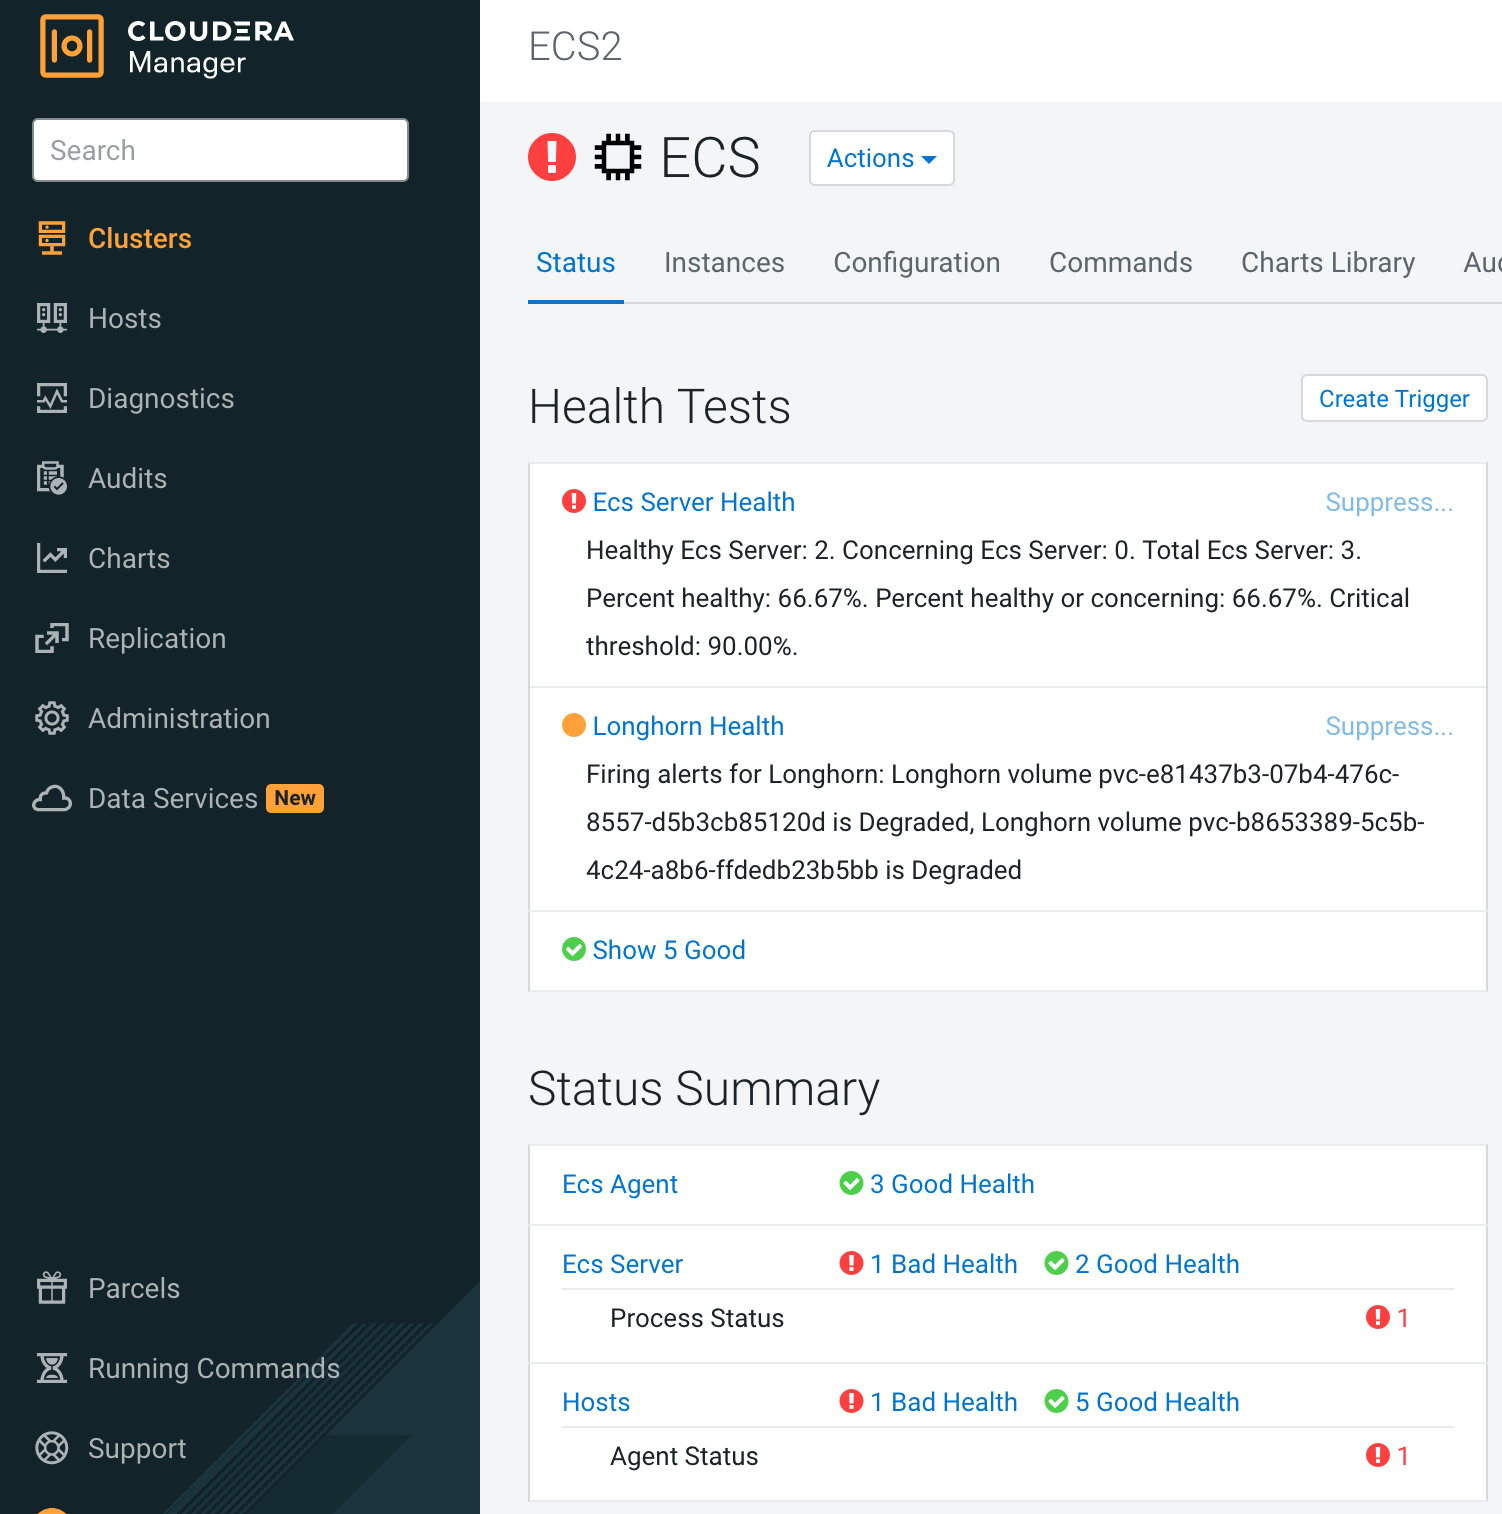
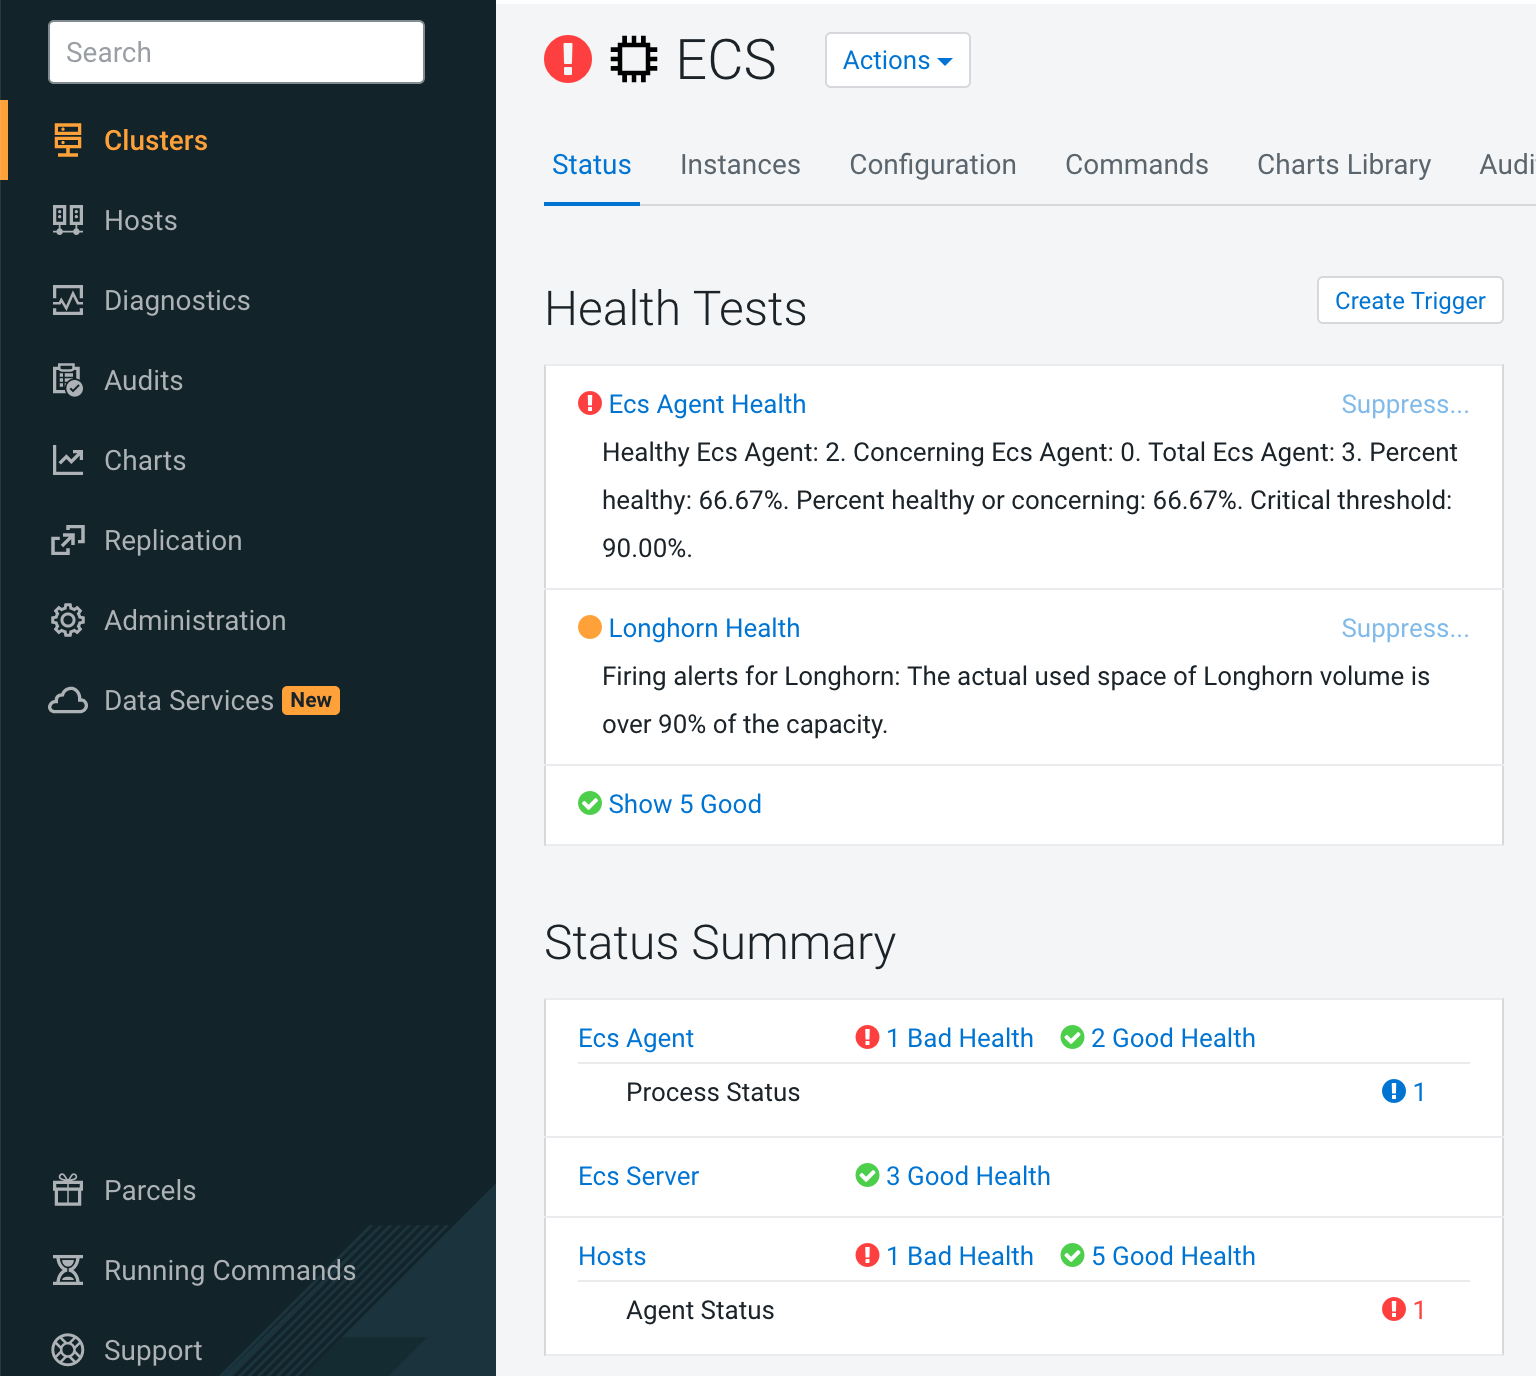
- As you can see from the CM UI, ECS server health/Control Plane Health/Kubernetes Health/Longhorn Health start to alarm.
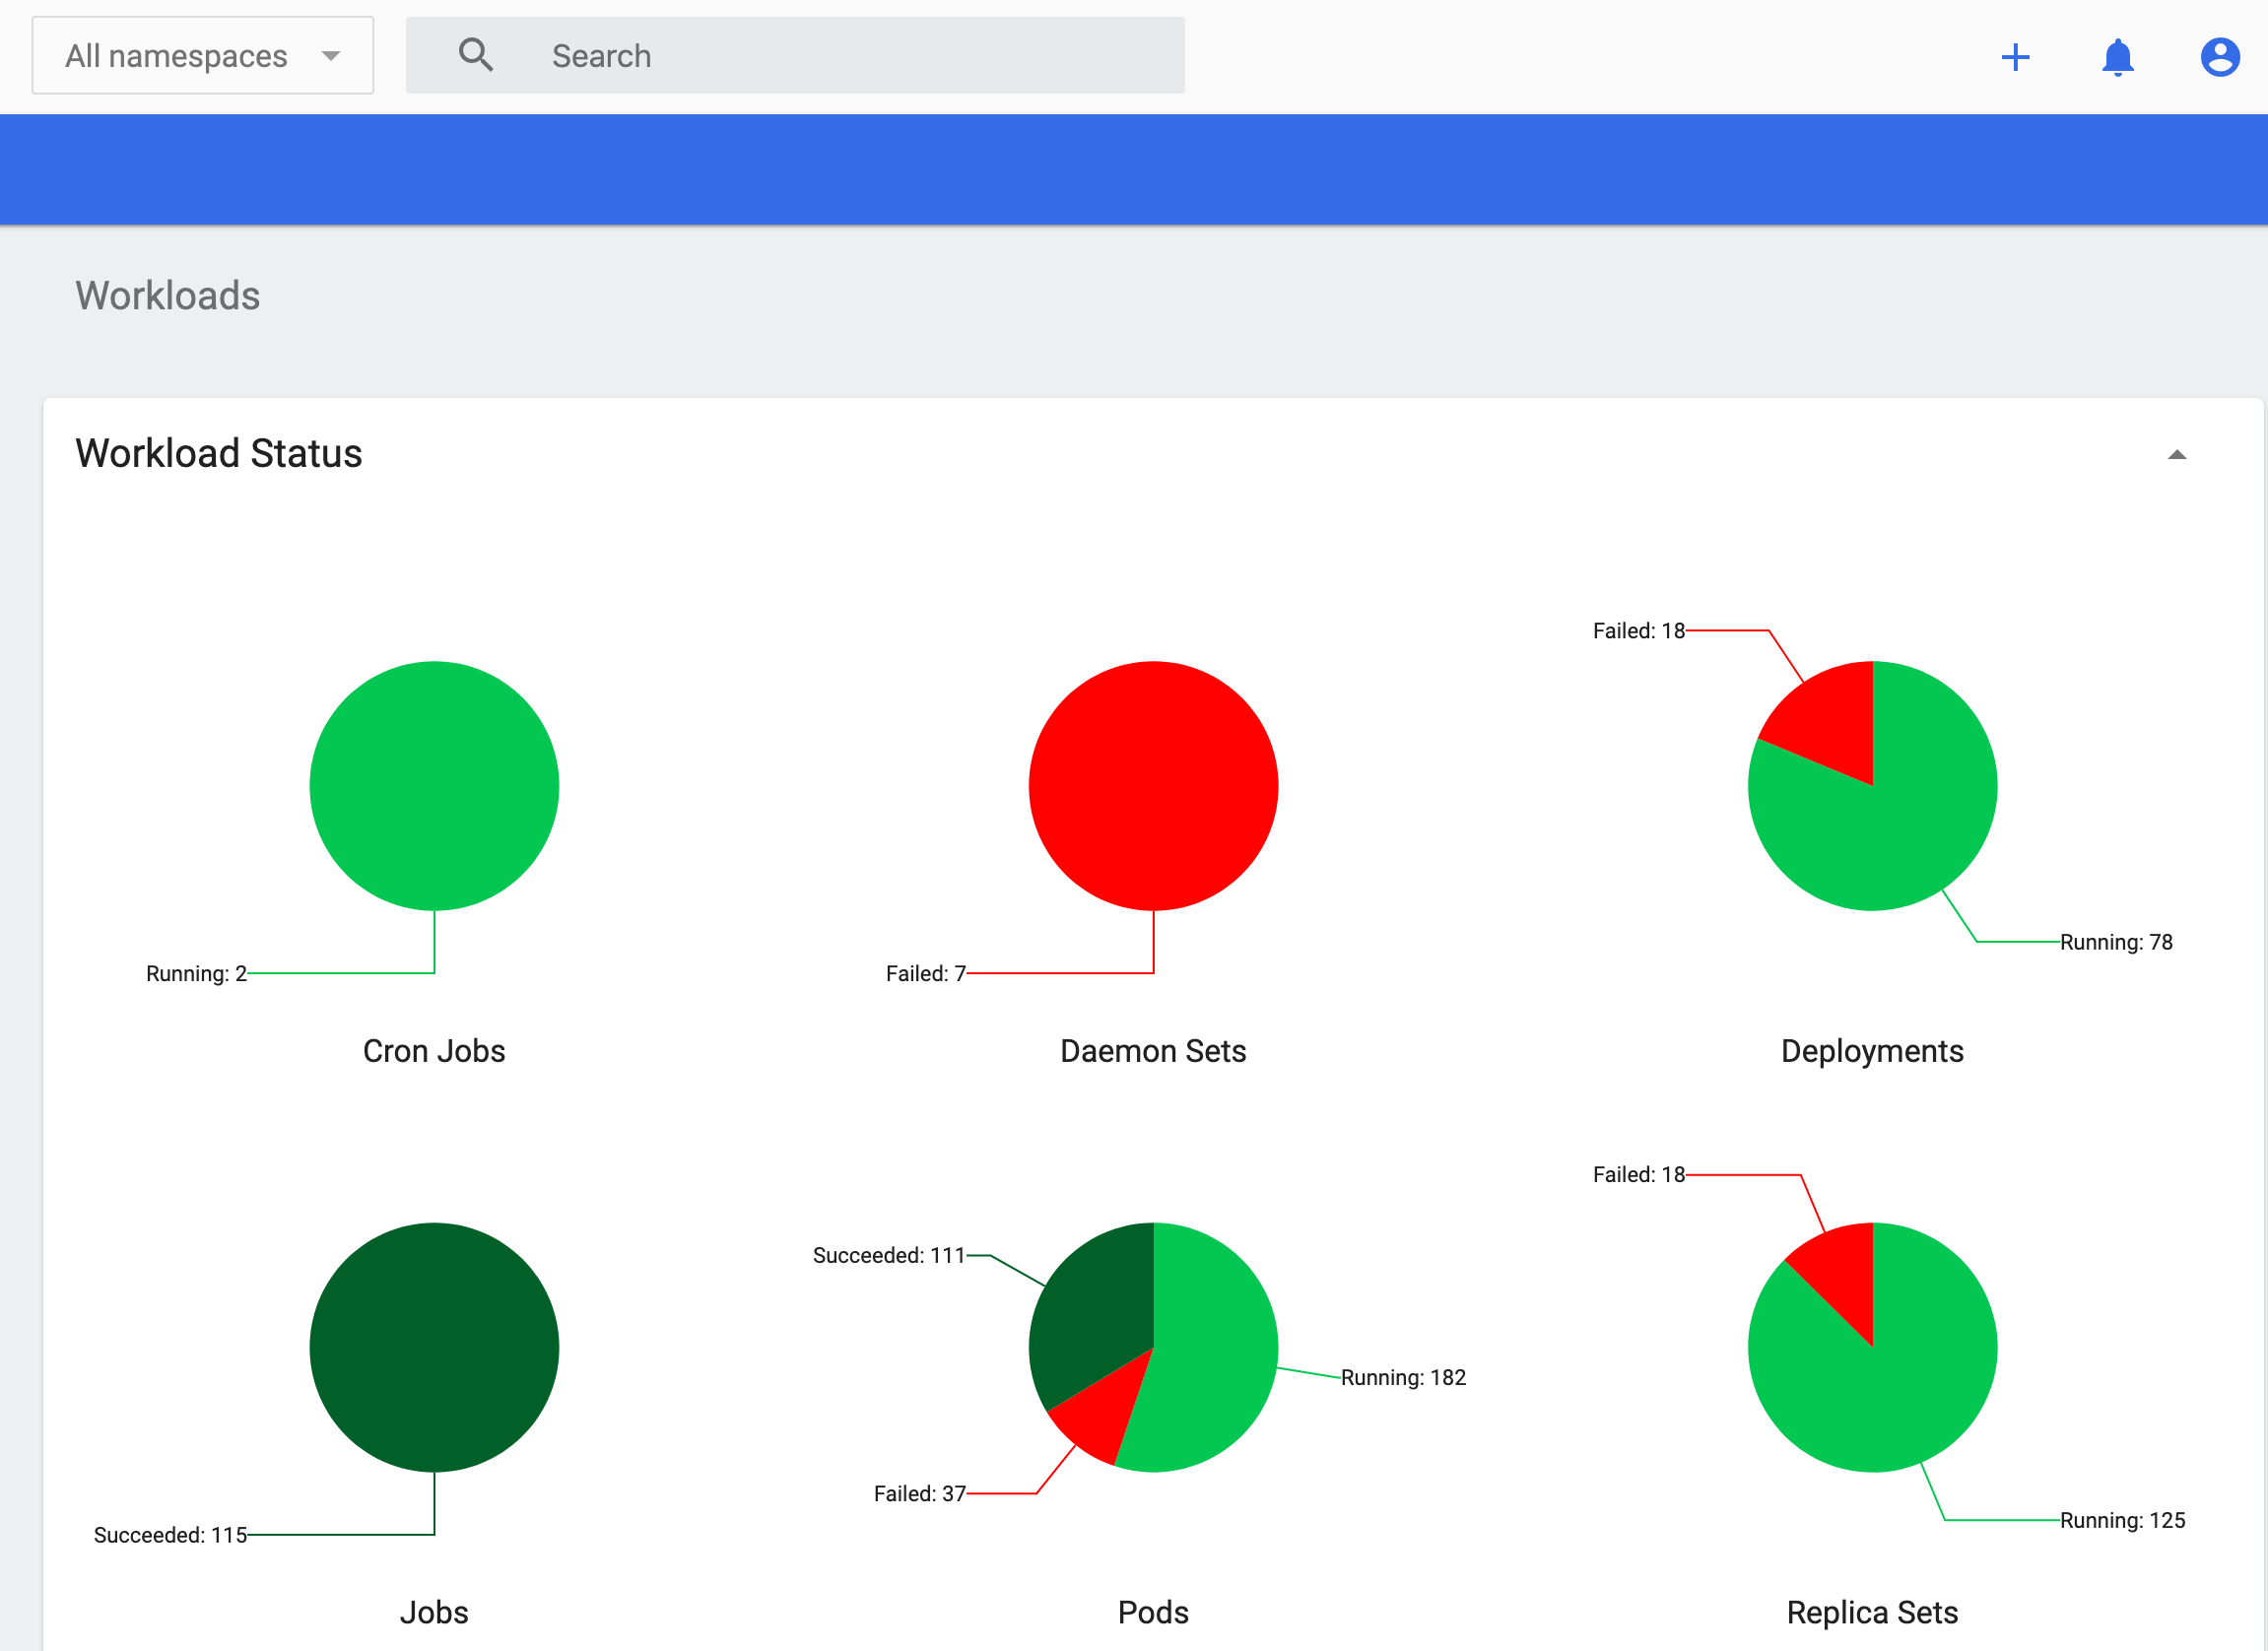
- You can also see many pod failures on the k8s web UI.
- Most of the pods from ds01 are stuck in terminating state after 300 seconds.
$ kubectl get pods -A -o wide --field-selector spec.nodeName=ds02.ecs.openstack.com
NAMESPACE                            NAME                                                              READY   STATUS        RESTARTS   AGE    IP               NODE                                    NOMINATED NODE   READINESS GATES
cdp                                  cdp-release-alert-admin-service-68f5c6dd7c-glt9k                  2/2     Terminating   0          2d4h   10.42.1.17       ds02.ecs.openstack.com   <none>           <none>
cdp                                  cdp-release-classic-clusters-7fdf69b6b-psmkj                      3/3     Terminating   0          2d4h   10.42.1.24       ds02.ecs.openstack.com   <none>           <none>
cdp                                  cdp-release-cluster-access-manager-b58448f45-hqpnq                2/2     Terminating   0          2d4h   10.42.1.26       ds02.ecs.openstack.com   <none>           <none>
cdp                                  cdp-release-dmx-559ccfb675-qjqb5                                  3/3     Terminating   0          2d4h   10.42.1.21       ds02.ecs.openstack.com   <none>           <none>
cdp                                  cdp-release-logger-alert-receiver-7cc7647d57-r78s4                2/2     Terminating   0          2d4h   10.42.1.19       ds02.ecs.openstack.com   <none>           <none>
cdp                                  cdp-release-metrics-server-exporter-cfff8b89f-tm7gs               2/2     Terminating   0          2d4h   10.42.1.18       ds02.ecs.openstack.com   <none>           <none>
cdp                                  cdp-release-thunderhead-de-api-675b74d89c-hl4h7                   2/2     Terminating   0          2d4h   10.42.1.15       ds02.ecs.openstack.com   <none>           <none>
cml01                                api-648d7bc885-xvv92                                              1/1     Terminating   1          122m   10.42.1.48       ds02.ecs.openstack.com   <none>           <none>
cml01                                cron-86888f4849-gn2kw                                             2/2     Terminating   0          122m   10.42.1.44       ds02.ecs.openstack.com   <none>           <none>
cml01                                ds-operator-5d79bf6756-k78kk                                      2/2     Terminating   0          122m   10.42.1.46       ds02.ecs.openstack.com   <none>           <none>
cml01                                ds-reconciler-5bfb4bb4fc-qgbrz                                    2/2     Terminating   0          122m   10.42.1.45       ds02.ecs.openstack.com   <none>           <none>
cml01                                livelog-publisher-5wjw5                                           2/2     Running       2          2d3h   10.42.1.34       ds02.ecs.openstack.com   <none>           <none>
cml01                                model-metrics-7654cf6945-7vsbm                                    1/1     Terminating   0          122m   10.42.1.47       ds02.ecs.openstack.com   <none>           <none>
cml01                                model-proxy-dd4d49678-tqj4h                                       2/2     Terminating   0          122m   10.42.1.43       ds02.ecs.openstack.com   <none>           <none>
compute-hive01                       hiveserver2-0                                                     1/1     Terminating   0          19m    10.42.1.53       ds02.ecs.openstack.com   <none>           <none>
compute-hive01                       huebackend-0                                                      1/1     Terminating   0          19m    10.42.1.52       ds02.ecs.openstack.com   <none>           <none>
compute-hive01                       huefrontend-5b67b68994-vqcp8                                      1/1     Terminating   0          19m    10.42.1.51       ds02.ecs.openstack.com   <none>           <none>
compute-hive01                       standalone-compute-operator-0                                     1/1     Terminating   0          19m    10.42.1.50       ds02.ecs.openstack.com   <none>           <none>
ecs-webhooks                         ecs-tolerations-webhook-7d9454f4f9-549qj                          1/1     Terminating   0          2d4h   10.42.1.3        ds02.ecs.openstack.com   <none>           <none>
impala-impala01                      catalogd-0                                                        2/2     Terminating   1          30h    10.42.1.39       ds02.ecs.openstack.com   <none>           <none>
impala-impala01                      huebackend-0                                                      2/2     Terminating   0          30h    10.42.1.37       ds02.ecs.openstack.com   <none>           <none>
impala-impala01                      huefrontend-7788ff9f45-8kvhj                                      1/1     Terminating   0          30h    10.42.1.36       ds02.ecs.openstack.com   <none>           <none>
impala-impala01                      impala-autoscaler-66cfbb7b7f-clsfg                                1/1     Terminating   0          30h    10.42.1.38       ds02.ecs.openstack.com   <none>           <none>
impala-impala01                      statestored-8bcbc5657-mw7kg                                       1/1     Terminating   0          30h    10.42.1.41       ds02.ecs.openstack.com   <none>           <none>
impala-impala01                      usage-monitor-645b96b78f-fvvvp                                    1/1     Terminating   0          30h    10.42.1.40       ds02.ecs.openstack.com   <none>           <none>
infra-prometheus                     infra-prometheus-operator-1-1672115985-prometheus-node-exp49m48   1/1     Running       0          2d4h   192.168.8.142   ds02.ecs.openstack.com   <none>           <none>
kube-system                          etcd-ds02.ecs.openstack.com                        1/1     Running       0          2d4h   192.168.8.142   ds02.ecs.openstack.com   <none>           <none>
kube-system                          kube-apiserver-ds02.ecs.openstack.com              1/1     Running       0          2d4h   192.168.8.142   ds02.ecs.openstack.com   <none>           <none>
kube-system                          kube-controller-manager-ds02.ecs.openstack.com     1/1     Running       0          2d4h   192.168.8.142   ds02.ecs.openstack.com   <none>           <none>
kube-system                          kube-proxy-ds02.ecs.openstack.com                  1/1     Running       0          2d4h   192.168.8.142   ds02.ecs.openstack.com   <none>           <none>
kube-system                          kube-scheduler-ds02.ecs.openstack.com              1/1     Running       0          2d4h   192.168.8.142   ds02.ecs.openstack.com   <none>           <none>
kube-system                          nvidia-device-plugin-daemonset-vfvm9                              1/1     Running       0          2d4h   10.42.1.14       ds02.ecs.openstack.com   <none>           <none>
kube-system                          rke2-canal-jgslr                                                  2/2     Running       0          2d4h   192.168.8.142   ds02.ecs.openstack.com   <none>           <none>
kube-system                          rke2-coredns-rke2-coredns-6775f768c8-82tkq                        1/1     Terminating   0          2d4h   10.42.1.2        ds02.ecs.openstack.com   <none>           <none>
kube-system                          rke2-ingress-nginx-controller-84fb589c78-bgkp5                    1/1     Terminating   0          2d4h   10.42.1.13       ds02.ecs.openstack.com   <none>           <none>
longhorn-system                      engine-image-ei-045573ad-thvcf                                    1/1     Running       0          2d4h   10.42.1.11       ds02.ecs.openstack.com   <none>           <none>
longhorn-system                      instance-manager-e-b4025e6d                                       1/1     Terminating   0          2d4h   10.42.1.10       ds02.ecs.openstack.com   <none>           <none>
longhorn-system                      instance-manager-r-dfa1437e                                       1/1     Terminating   0          2d4h   10.42.1.9        ds02.ecs.openstack.com   <none>           <none>
longhorn-system                      longhorn-admission-webhook-584567fd57-sfmmg                       1/1     Terminating   0          2d4h   10.42.1.8        ds02.ecs.openstack.com   <none>           <none>
longhorn-system                      longhorn-conversion-webhook-74bdb64887-mq45q                      1/1     Terminating   0          2d4h   10.42.1.5        ds02.ecs.openstack.com   <none>           <none>
longhorn-system                      longhorn-csi-plugin-p24j8                                         2/2     Running       0          2d4h   10.42.1.12       ds02.ecs.openstack.com   <none>           <none>
longhorn-system                      longhorn-manager-h2vb2                                            1/1     Running       0          2d4h   10.42.1.6        ds02.ecs.openstack.com   <none>           <none>
longhorn-system                      longhorn-ui-6f94dfc58c-jw7r8                                      1/1     Terminating   0          2d4h   10.42.1.7        ds02.ecs.openstack.com   <none>           <none>
warehouse-default-datalake-default   metastore-0                                                       1/1     Terminating   0          2d3h   10.42.1.27       ds02.ecs.openstack.com   <none>           <none>
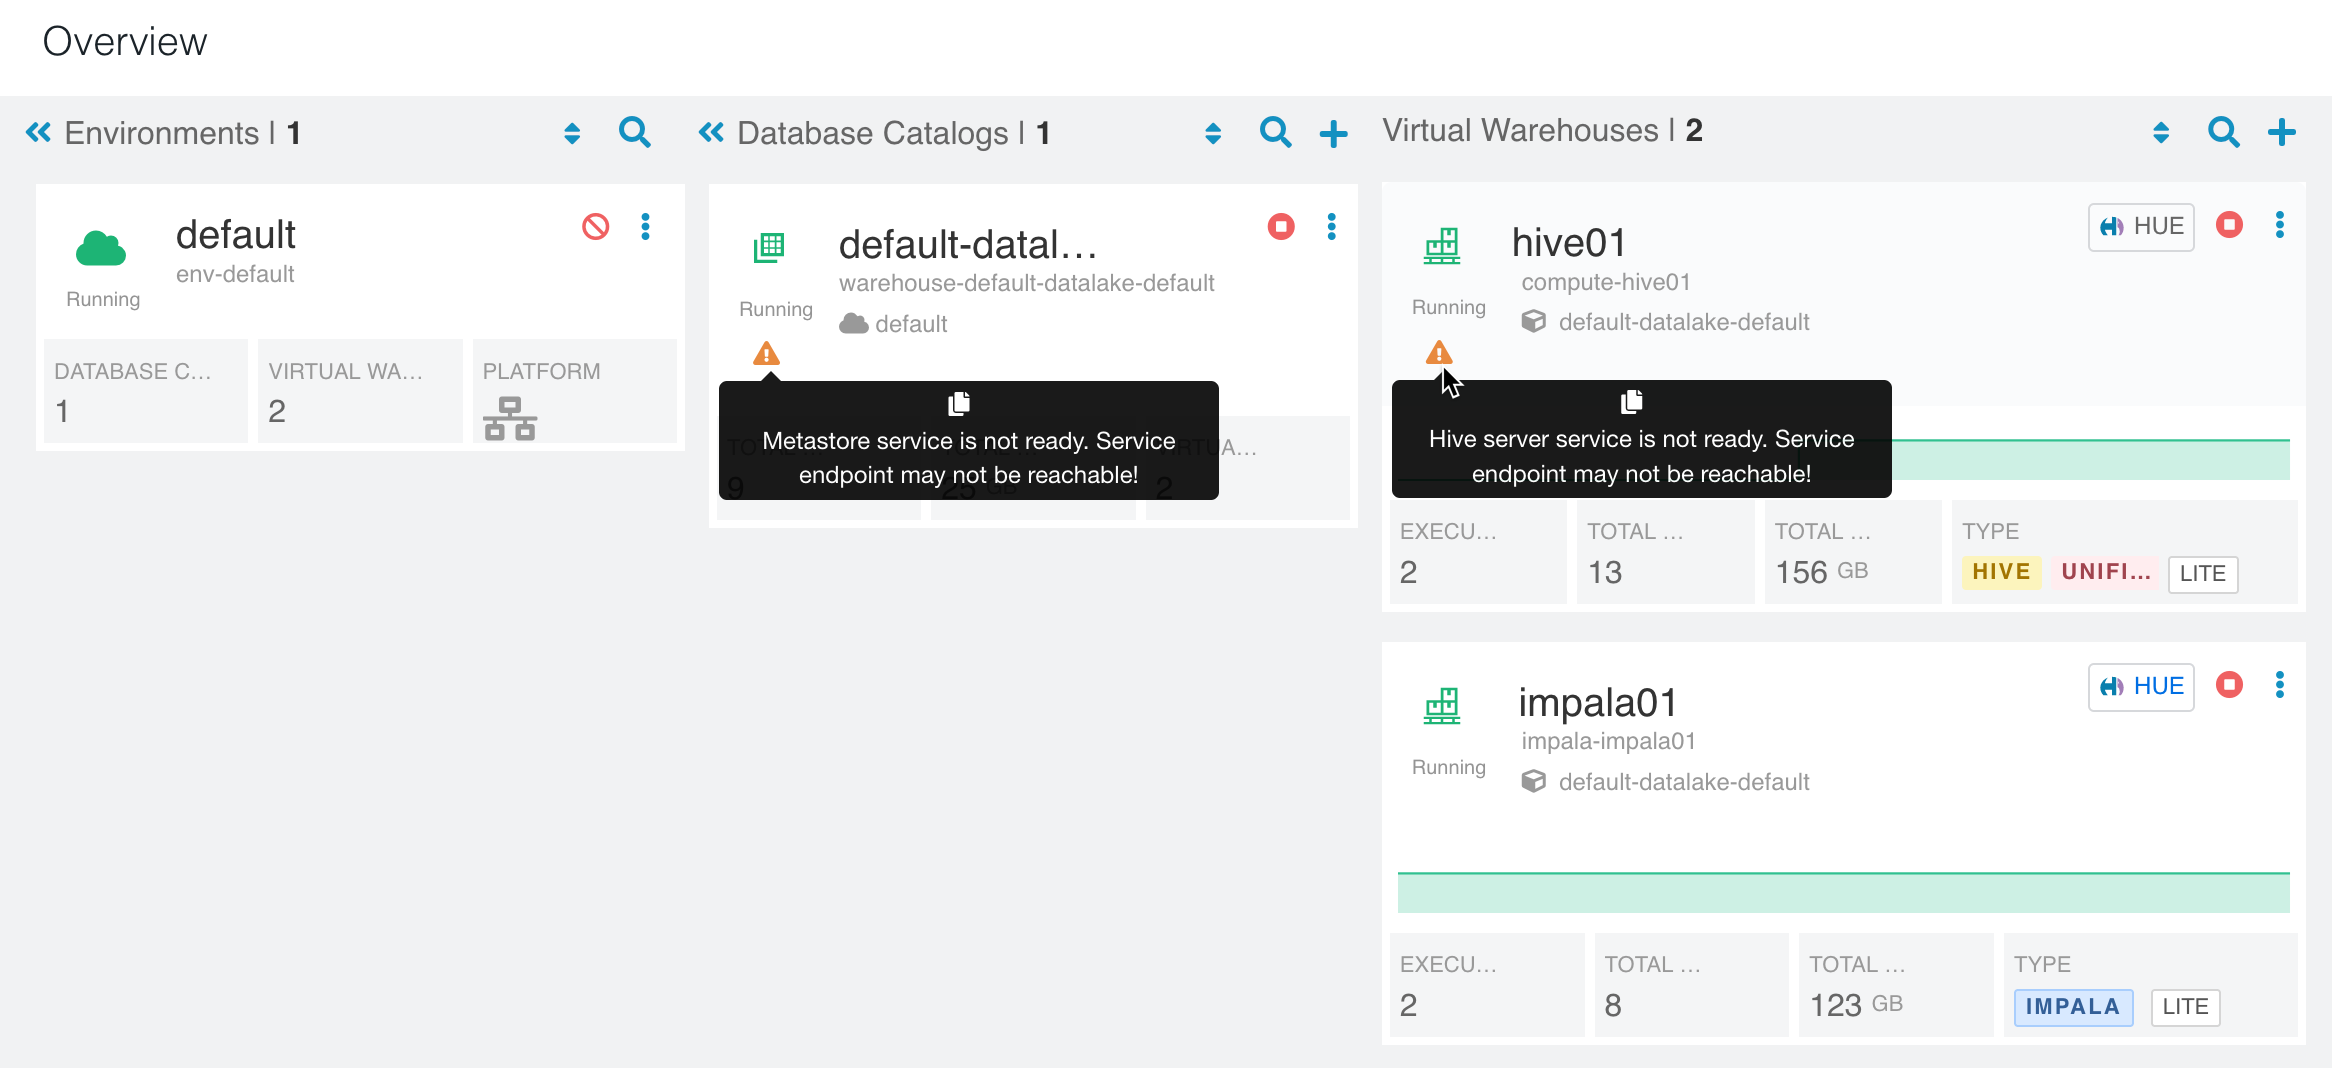
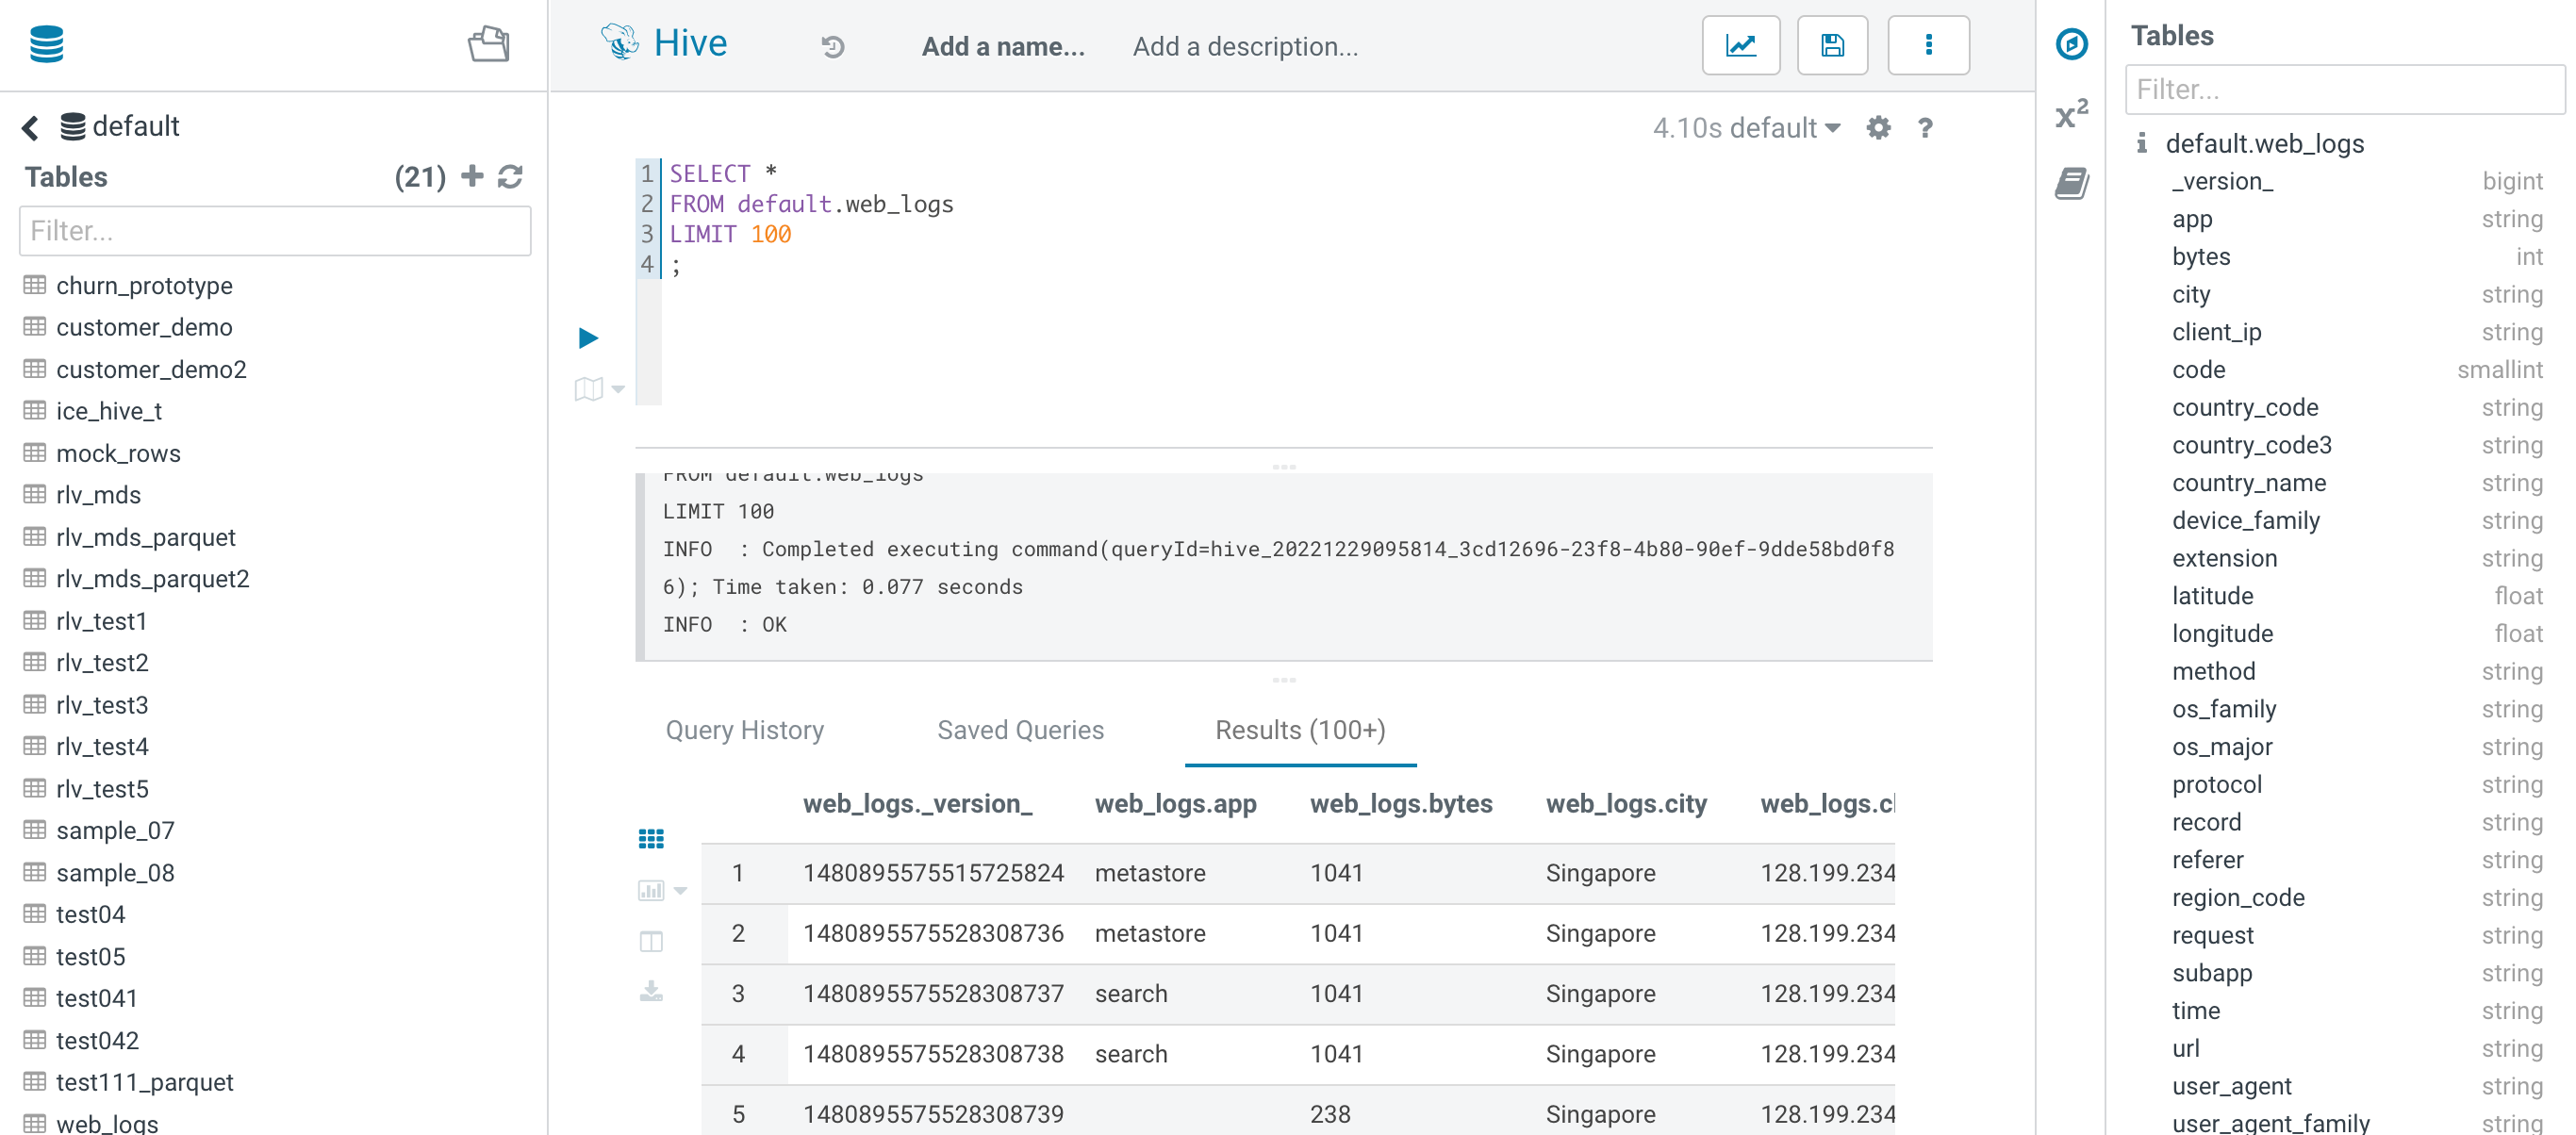
- CDW cluster is abnormal with warnings “Hive server service is not ready. Service endpoint may not be reachable! Error Code : undefined”.
- Job pod-reaper forced deleting pods in terminating state after 25 minutes of service interruption.
$ kubectl logs -n pod-reaper pod-reaper-27871780-tpwzm
Thu Dec 29 09:40:01 UTC 2022 Starting pod-reaper [Reap older than: 10 minute(s)][Namespace regex: *UNKNOWN*]
Thu Dec 29 09:40:01 UTC 2022 processing namespace cml01
Thu Dec 29 09:40:01 UTC 2022 processing namespace cdp
Thu Dec 29 09:40:01 UTC 2022 processing namespace cml01-user-1
Thu Dec 29 09:40:01 UTC 2022 processing namespace compute-hive01
Thu Dec 29 09:40:01 UTC 2022 processing namespace default
Thu Dec 29 09:40:01 UTC 2022 processing namespace impala-impala01
Thu Dec 29 09:40:01 UTC 2022 processing namespace default-ad522d9e-log-router
Thu Dec 29 09:40:01 UTC 2022 processing namespace default-ad522d9e-monitoring-platform
Thu Dec 29 09:40:01 UTC 2022 processing namespace ecs-webhooks
Thu Dec 29 09:40:01 UTC 2022 processing namespace infra-prometheus
Thu Dec 29 09:40:02 UTC 2022 Force delete pod ecs-tolerations-webhook-7d9454f4f9-549qj in namespace ecs-webhooks with deletion timestamp: 2022-12-29T09:20:25Z
warning: Immediate deletion does not wait for confirmation that the running resource has been terminated. The resource may continue to run on the cluster indefinitely.
Thu Dec 29 09:40:02 UTC 2022 Force delete pod hiveserver2-0 in namespace compute-hive01 with deletion timestamp: 2022-12-29T09:20:25Z
pod "ecs-tolerations-webhook-7d9454f4f9-549qj" force deleted
Thu Dec 29 09:40:02 UTC 2022 Force delete pod catalogd-0 in namespace impala-impala01 with deletion timestamp: 2022-12-29T09:20:25Z
Thu Dec 29 09:40:02 UTC 2022 Successfully force deleted pod ecs-tolerations-webhook-7d9454f4f9-549qj in namespace ecs-webhooks
warning: Immediate deletion does not wait for confirmation that the running resource has been terminated. The resource may continue to run on the cluster indefinitely.
pod "hiveserver2-0" force deleted
warning: Immediate deletion does not wait for confirmation that the running resource has been terminated. The resource may continue to run on the cluster indefinitely.
Thu Dec 29 09:40:02 UTC 2022 Successfully force deleted pod hiveserver2-0 in namespace compute-hive01
Thu Dec 29 09:40:02 UTC 2022 Force delete pod huebackend-0 in namespace compute-hive01 with deletion timestamp: 2022-12-29T09:20:25Z
pod "catalogd-0" force deleted
Thu Dec 29 09:40:02 UTC 2022 Successfully force deleted pod catalogd-0 in namespace impala-impala01
Thu Dec 29 09:40:02 UTC 2022 Force delete pod api-648d7bc885-xvv92 in namespace cml01 with deletion timestamp: 2022-12-29T09:20:25Z
Thu Dec 29 09:40:02 UTC 2022 Force delete pod huebackend-0 in namespace impala-impala01 with deletion timestamp: 2022-12-29T09:20:25Z
warning: Immediate deletion does not wait for confirmation that the running resource has been terminated. The resource may continue to run on the cluster indefinitely.
Thu Dec 29 09:40:02 UTC 2022 Force delete pod cdp-release-alert-admin-service-68f5c6dd7c-glt9k in namespace cdp with deletion timestamp: 2022-12-29T09:20:25Z
warning: Immediate deletion does not wait for confirmation that the running resource has been terminated. The resource may continue to run on the cluster indefinitely.
warning: Immediate deletion does not wait for confirmation that the running resource has been terminated. The resource may continue to run on the cluster indefinitely.
pod "huebackend-0" force deleted
Thu Dec 29 09:40:02 UTC 2022 Successfully force deleted pod huebackend-0 in namespace compute-hive01
......
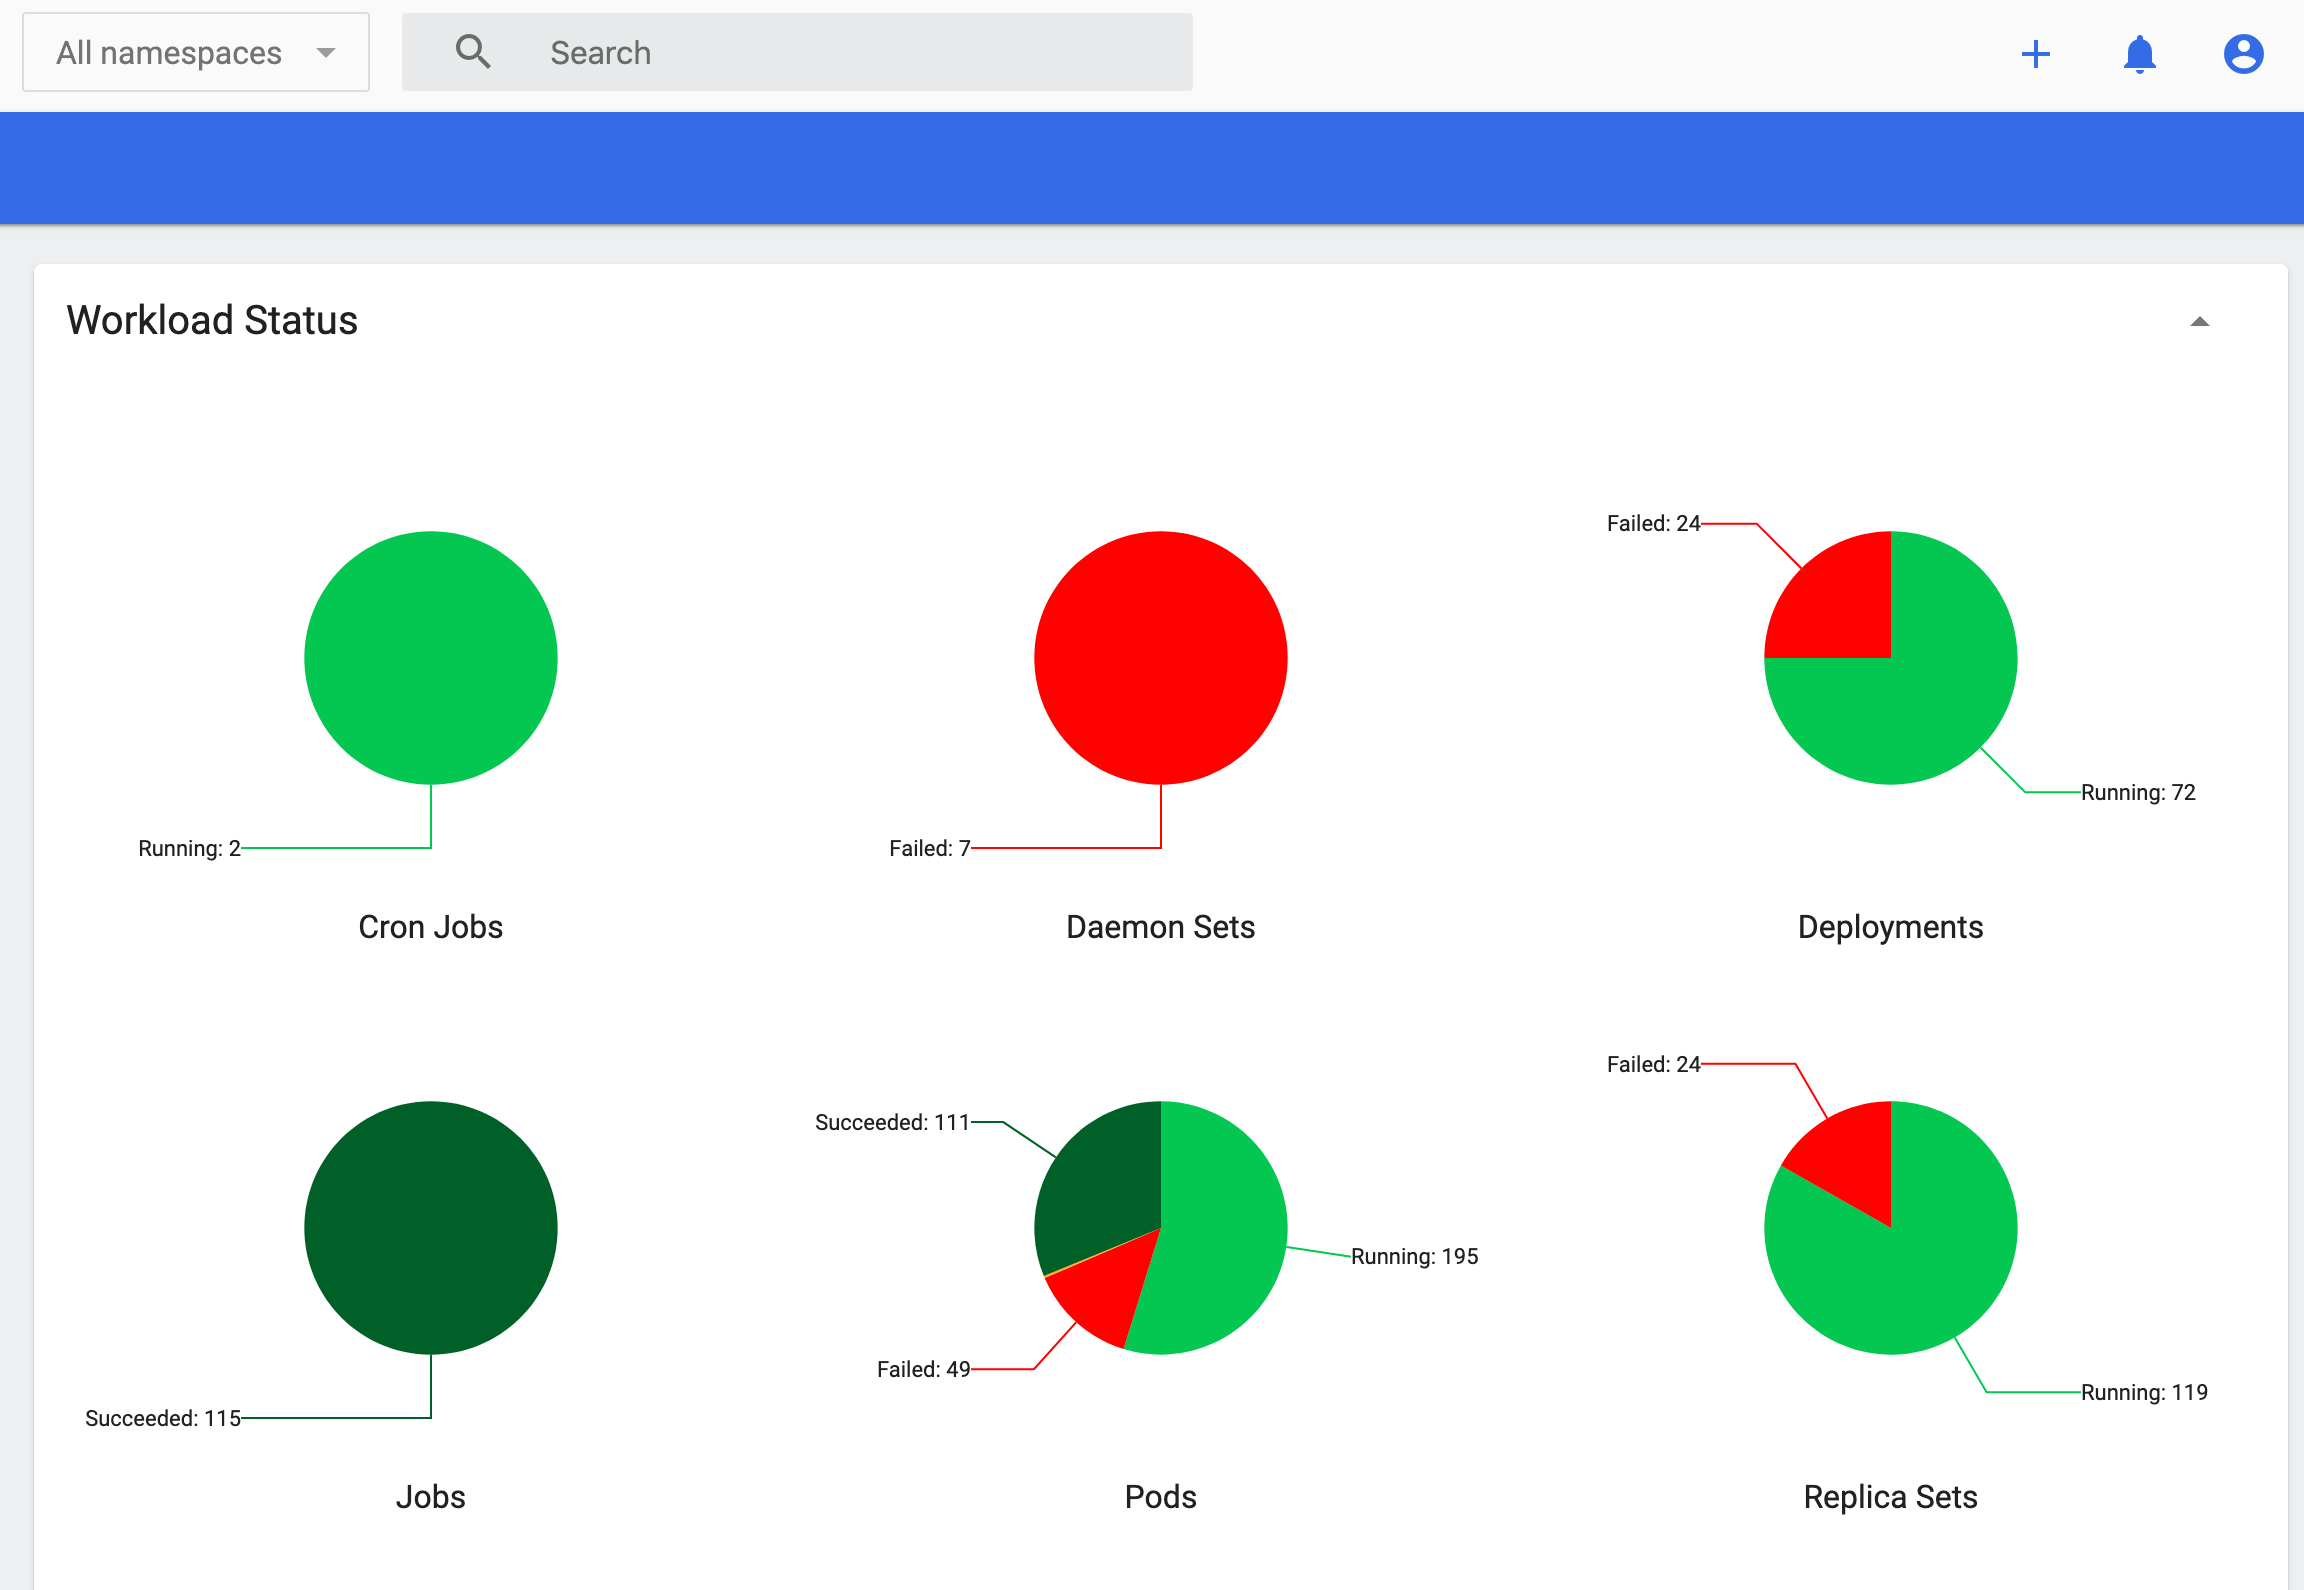
- The remaining 13 pods on ds02 are basically daemonset type. Pod rke2-ingress-nginx-controller is an exception.
$ kubectl get pods -A -o wide --field-selector spec.nodeName=ds02.ecs.openstack.com
NAMESPACE          NAME                                                              READY   STATUS    RESTARTS   AGE    IP               NODE                                    NOMINATED NODE   READINESS GATES
cml01              livelog-publisher-5wjw5                                           2/2     Running   2          2d3h   10.42.1.34       ds02.ecs.openstack.com   <none>           <none>
infra-prometheus   infra-prometheus-operator-1-1672115985-prometheus-node-exp49m48   1/1     Running   0          2d5h   192.168.8.142   ds02.ecs.openstack.com   <none>           <none>
kube-system        etcd-ds02.ecs.openstack.com                        1/1     Running   0          2d5h   192.168.8.142   ds02.ecs.openstack.com   <none>           <none>
kube-system        kube-apiserver-ds02.ecs.openstack.com              1/1     Running   0          2d5h   192.168.8.142   ds02.ecs.openstack.com   <none>           <none>
kube-system        kube-controller-manager-ds02.ecs.openstack.com     1/1     Running   0          2d5h   192.168.8.142   ds02.ecs.openstack.com   <none>           <none>
kube-system        kube-proxy-ds02.ecs.openstack.com                  1/1     Running   0          2d5h   192.168.8.142   ds02.ecs.openstack.com   <none>           <none>
kube-system        kube-scheduler-ds02.ecs.openstack.com              1/1     Running   0          2d5h   192.168.8.142   ds02.ecs.openstack.com   <none>           <none>
kube-system        nvidia-device-plugin-daemonset-vfvm9                              1/1     Running   0          2d5h   10.42.1.14       ds02.ecs.openstack.com   <none>           <none>
kube-system        rke2-canal-jgslr                                                  2/2     Running   0          2d5h   192.168.8.142   ds02.ecs.openstack.com   <none>           <none>
kube-system        rke2-ingress-nginx-controller-84fb589c78-lqxrh                    0/1     Pending   0          24m    <none>           ds02.ecs.openstack.com   <none>           <none>
longhorn-system    engine-image-ei-045573ad-thvcf                                    1/1     Running   0          2d5h   10.42.1.11       ds02.ecs.openstack.com   <none>           <none>
longhorn-system    longhorn-csi-plugin-p24j8                                         2/2     Running   0          2d5h   10.42.1.12       ds02.ecs.openstack.com   <none>           <none>
longhorn-system    longhorn-manager-h2vb2                                            1/1     Running   0          2d5h   10.42.1.6        ds02.ecs.openstack.com   <none>           <none>
- We also see the same result on k8s web UI, only 13 failed pods. But these abnormal pods will not affect existing applications at all.
- Confirm that CP/CDW/CML works well
4. Case #2. An ECS Agent is unreachable
- Check all ECS nodes
$ kubectl get node
NAME                                    STATUS   ROLES                       AGE    VERSION
ds01.ecs.openstack.com   Ready    control-plane,etcd,master   2d4h   v1.21.14+rke2r1
ds02.ecs.openstack.com   Ready    control-plane,etcd,master   2d4h   v1.21.14+rke2r1
ds03.ecs.openstack.com   Ready    control-plane,etcd,master   2d4h   v1.21.14+rke2r1
ds04.ecs.openstack.com   Ready    <none>                      2d4h   v1.21.14+rke2r1
ds05.ecs.openstack.com   Ready    <none>                      2d4h   v1.21.14+rke2r1
ds06.ecs.openstack.com   Ready    <none>                      2d4h   v1.21.14+rke2r1
- Check the state of ECS roles on CM UI
- Check all Kubernetes objects
- Check all pods running on ds04
$ kubectl get pods -A -o wide --field-selector spec.nodeName=ds04.ecs.openstack.com
NAMESPACE                              NAME                                                              READY   STATUS      RESTARTS   AGE    IP               NODE                                    NOMINATED NODE   READINESS GATES
cdp                                    cdp-release-dps-gateway-1.0-595cdcfcd6-kvp7f                      3/3     Running     0          2d7h   10.42.5.18       ds04.ecs.openstack.com   <none>           <none>
cdp                                    cdp-release-grafana-6f577d4bdb-4ll59                              3/3     Running     0          2d5h   10.42.5.46       ds04.ecs.openstack.com   <none>           <none>
cdp                                    cdp-release-monitoring-app-6c9794967-jcdrf                        2/2     Running     0          2d6h   10.42.5.32       ds04.ecs.openstack.com   <none>           <none>
cdp                                    cdp-release-monitoring-metricproxy-6c46bb46d8-jgq62               2/2     Running     0          2d6h   10.42.5.33       ds04.ecs.openstack.com   <none>           <none>
cdp                                    cdp-release-monitoring-pvcservice-5cdb55c9c5-rnp7g                2/2     Running     0          2d6h   10.42.5.31       ds04.ecs.openstack.com   <none>           <none>
cdp                                    cdp-release-thunderhead-kerberosmgmt-api-7d484b8fd6-j9vb2         2/2     Running     0          2d7h   10.42.5.21       ds04.ecs.openstack.com   <none>           <none>
cdp                                    cdp-release-thunderhead-sdx2-api-6f9989c764-8cqsj                 2/2     Running     0          2d7h   10.42.5.19       ds04.ecs.openstack.com   <none>           <none>
cdp                                    echoserver-9dfbcd89b-h6z4n                                        1/1     Running     0          2d7h   10.42.5.17       ds04.ecs.openstack.com   <none>           <none>
cml01                                  livelog-publisher-989hx                                           2/2     Running     2          2d5h   10.42.5.45       ds04.ecs.openstack.com   <none>           <none>
cml01                                  mlx-cml01-pod-evaluator-6445d6946b-txlrq                          1/1     Running     0          2d5h   192.168.8.144   ds04.ecs.openstack.com   <none>           <none>
cml01                                  model-metrics-db-0                                                1/1     Running     0          2d5h   10.42.5.47       ds04.ecs.openstack.com   <none>           <none>
cml01                                  s2i-builder-58d875f44c-4zn4z                                      2/2     Running     6          2d5h   10.42.5.48       ds04.ecs.openstack.com   <none>           <none>
cml01                                  s2i-builder-58d875f44c-ftqhl                                      2/2     Running     6          2d5h   10.42.5.49       ds04.ecs.openstack.com   <none>           <none>
cml01                                  s2i-builder-58d875f44c-kqkrk                                      2/2     Running     6          2d5h   10.42.5.50       ds04.ecs.openstack.com   <none>           <none>
compute-hive01                         huebackend-0                                                      1/1     Running     0          124m   10.42.5.55       ds04.ecs.openstack.com   <none>           <none>
default-ad522d9e-monitoring-platform   monitoring-logger-alert-receiver-7485d89576-vg6n4                 2/2     Running     0          2d6h   10.42.5.34       ds04.ecs.openstack.com   <none>           <none>
default-ad522d9e-monitoring-platform   monitoring-metrics-server-exporter-7f977ddff5-ht2n6               2/2     Running     0          2d6h   10.42.5.35       ds04.ecs.openstack.com   <none>           <none>
default-ad522d9e-monitoring-platform   monitoring-prometheus-server-664745446f-pw6jc                     3/3     Running     0          2d6h   10.42.5.37       ds04.ecs.openstack.com   <none>           <none>
impala-impala01                        impala-executor-000-0                                             1/1     Running     0          32h    10.42.5.54       ds04.ecs.openstack.com   <none>           <none>
infra-prometheus                       infra-prometheus-operator-1-1672115985-prometheus-node-expzhqf7   1/1     Running     0          2d7h   192.168.8.144   ds04.ecs.openstack.com   <none>           <none>
infra-prometheus                       infra-prometheus-operator-operator-854bdc78b6-2whcf               1/1     Running     0          2d7h   10.42.5.15       ds04.ecs.openstack.com   <none>           <none>
kube-system                            kube-proxy-ds04.ecs.openstack.com                  1/1     Running     0          2d7h   192.168.8.144   ds04.ecs.openstack.com   <none>           <none>
kube-system                            nvidia-device-plugin-daemonset-j278f                              1/1     Running     0          2d7h   10.42.5.16       ds04.ecs.openstack.com   <none>           <none>
kube-system                            rke2-canal-kmtnv                                                  2/2     Running     0          2d7h   192.168.8.144   ds04.ecs.openstack.com   <none>           <none>
longhorn-system                        csi-attacher-559b9bc796-2wv7w                                     1/1     Running     1          2d7h   10.42.5.6        ds04.ecs.openstack.com   <none>           <none>
longhorn-system                        csi-provisioner-d7df997cf-g7wbj                                   1/1     Running     0          2d7h   10.42.5.8        ds04.ecs.openstack.com   <none>           <none>
longhorn-system                        csi-resizer-9db78b867-zkb9k                                       1/1     Running     0          2d7h   10.42.5.7        ds04.ecs.openstack.com   <none>           <none>
longhorn-system                        csi-snapshotter-74d97b97bf-nlqk2                                  1/1     Running     1          2d7h   10.42.5.9        ds04.ecs.openstack.com   <none>           <none>
longhorn-system                        engine-image-ei-045573ad-knqc5                                    1/1     Running     0          2d7h   10.42.5.2        ds04.ecs.openstack.com   <none>           <none>
longhorn-system                        instance-manager-e-3cf7ad0b                                       1/1     Running     0          2d7h   10.42.5.4        ds04.ecs.openstack.com   <none>           <none>
longhorn-system                        instance-manager-r-bf10b574                                       1/1     Running     0          2d7h   10.42.5.5        ds04.ecs.openstack.com   <none>           <none>
longhorn-system                        longhorn-csi-plugin-qxwk6                                         2/2     Running     0          2d7h   10.42.5.10       ds04.ecs.openstack.com   <none>           <none>
longhorn-system                        longhorn-manager-mbs49                                            1/1     Running     0          2d7h   10.42.5.3        ds04.ecs.openstack.com   <none>           <none>
pod-reaper                             pod-reaper-27871790-rcg96                                         0/1     Completed   0          114m   10.42.5.57       ds04.ecs.openstack.com   <none>           <none>
pod-reaper                             pod-reaper-27871810-4774b                                         0/1     Completed   0          94m    10.42.5.58       ds04.ecs.openstack.com   <none>           <none>
vault-system                           vault-0                                                           1/1     Running     0          2d7h   10.42.5.11       ds04.ecs.openstack.com   <none>           <none>
warehouse-default-datalake-default     hue-query-processor-0                                             1/1     Running     0          2d5h   10.42.5.44       ds04.ecs.openstack.com   <none>           <none>
warehouse-default-datalake-default     metastore-0                                                       1/1     Running     0          124m   10.42.5.56       ds04.ecs.openstack.com   <none>           <none>
- Shutdown node ds04
- Confirm that only ds04 is NotReady
$ kubectl get node
NAME                                    STATUS     ROLES                       AGE    VERSION
ds01.ecs.openstack.com   Ready      control-plane,etcd,master   2d7h   v1.21.14+rke2r1
ds02.ecs.openstack.com   Ready      control-plane,etcd,master   2d7h   v1.21.14+rke2r1
ds03.ecs.openstack.com   Ready      control-plane,etcd,master   2d7h   v1.21.14+rke2r1
ds04.ecs.openstack.com   NotReady   <none>                      2d7h   v1.21.14+rke2r1
ds05.ecs.openstack.com   Ready      <none>                      2d7h   v1.21.14+rke2r1
ds06.ecs.openstack.com   Ready      <none>                      2d7h   v1.21.14+rke2r1
- As you can see from the HAProxy UI, all ECS server ports ( http port 80, https port 434) are green.
- As you can see from the CM UI, ECS server health/Control Plane Health/Kubernetes Health/Longhorn Health start to alarm.
- You can also see many pod failures on the k8s web UI.
- Most of the pods from ds04 are stuck in terminating state after 300 seconds.
$ kubectl get pods -A -o wide --field-selector spec.nodeName=ds04.ecs.openstack.com
NAMESPACE                              NAME                                                              READY   STATUS        RESTARTS   AGE    IP               NODE                                    NOMINATED NODE   READINESS GATES
cdp                                    cdp-release-dps-gateway-1.0-595cdcfcd6-kvp7f                      3/3     Terminating   0          2d7h   10.42.5.18       ds04.ecs.openstack.com   <none>           <none>
cdp                                    cdp-release-grafana-6f577d4bdb-4ll59                              3/3     Terminating   0          2d5h   10.42.5.46       ds04.ecs.openstack.com   <none>           <none>
cdp                                    cdp-release-monitoring-app-6c9794967-jcdrf                        2/2     Terminating   0          2d7h   10.42.5.32       ds04.ecs.openstack.com   <none>           <none>
cdp                                    cdp-release-monitoring-metricproxy-6c46bb46d8-jgq62               2/2     Terminating   0          2d7h   10.42.5.33       ds04.ecs.openstack.com   <none>           <none>
cdp                                    cdp-release-monitoring-pvcservice-5cdb55c9c5-rnp7g                2/2     Terminating   0          2d7h   10.42.5.31       ds04.ecs.openstack.com   <none>           <none>
cdp                                    cdp-release-thunderhead-kerberosmgmt-api-7d484b8fd6-j9vb2         2/2     Terminating   0          2d7h   10.42.5.21       ds04.ecs.openstack.com   <none>           <none>
cdp                                    cdp-release-thunderhead-sdx2-api-6f9989c764-8cqsj                 2/2     Terminating   0          2d7h   10.42.5.19       ds04.ecs.openstack.com   <none>           <none>
cdp                                    echoserver-9dfbcd89b-h6z4n                                        1/1     Terminating   0          2d7h   10.42.5.17       ds04.ecs.openstack.com   <none>           <none>
cml01                                  livelog-publisher-989hx                                           2/2     Running       2          2d5h   10.42.5.45       ds04.ecs.openstack.com   <none>           <none>
cml01                                  mlx-cml01-pod-evaluator-6445d6946b-txlrq                          1/1     Terminating   0          2d5h   192.168.8.144   ds04.ecs.openstack.com   <none>           <none>
cml01                                  s2i-builder-58d875f44c-4zn4z                                      2/2     Terminating   6          2d5h   10.42.5.48       ds04.ecs.openstack.com   <none>           <none>
cml01                                  s2i-builder-58d875f44c-ftqhl                                      2/2     Terminating   6          2d5h   10.42.5.49       ds04.ecs.openstack.com   <none>           <none>
cml01                                  s2i-builder-58d875f44c-kqkrk                                      2/2     Terminating   6          2d5h   10.42.5.50       ds04.ecs.openstack.com   <none>           <none>
compute-hive01                         huebackend-0                                                      1/1     Terminating   0          148m   10.42.5.55       ds04.ecs.openstack.com   <none>           <none>
default-ad522d9e-monitoring-platform   monitoring-logger-alert-receiver-7485d89576-vg6n4                 2/2     Terminating   0          2d7h   10.42.5.34       ds04.ecs.openstack.com   <none>           <none>
default-ad522d9e-monitoring-platform   monitoring-metrics-server-exporter-7f977ddff5-ht2n6               2/2     Terminating   0          2d7h   10.42.5.35       ds04.ecs.openstack.com   <none>           <none>
default-ad522d9e-monitoring-platform   monitoring-prometheus-server-664745446f-pw6jc                     3/3     Terminating   0          2d7h   10.42.5.37       ds04.ecs.openstack.com   <none>           <none>
impala-impala01                        impala-executor-000-0                                             1/1     Terminating   0          33h    10.42.5.54       ds04.ecs.openstack.com   <none>           <none>
infra-prometheus                       infra-prometheus-operator-1-1672115985-prometheus-node-expzhqf7   1/1     Running       0          2d7h   192.168.8.144   ds04.ecs.openstack.com   <none>           <none>
infra-prometheus                       infra-prometheus-operator-operator-854bdc78b6-2whcf               1/1     Terminating   0          2d7h   10.42.5.15       ds04.ecs.openstack.com   <none>           <none>
kube-system                            kube-proxy-ds04.ecs.openstack.com                  1/1     Running       0          2d7h   192.168.8.144   ds04.ecs.openstack.com   <none>           <none>
kube-system                            nvidia-device-plugin-daemonset-j278f                              1/1     Running       0          2d7h   10.42.5.16       ds04.ecs.openstack.com   <none>           <none>
kube-system                            rke2-canal-kmtnv                                                  2/2     Running       0          2d7h   192.168.8.144   ds04.ecs.openstack.com   <none>           <none>
longhorn-system                        csi-attacher-559b9bc796-2wv7w                                     1/1     Terminating   1          2d7h   10.42.5.6        ds04.ecs.openstack.com   <none>           <none>
longhorn-system                        csi-provisioner-d7df997cf-g7wbj                                   1/1     Terminating   0          2d7h   10.42.5.8        ds04.ecs.openstack.com   <none>           <none>
longhorn-system                        csi-resizer-9db78b867-zkb9k                                       1/1     Terminating   0          2d7h   10.42.5.7        ds04.ecs.openstack.com   <none>           <none>
longhorn-system                        csi-snapshotter-74d97b97bf-nlqk2                                  1/1     Terminating   1          2d7h   10.42.5.9        ds04.ecs.openstack.com   <none>           <none>
longhorn-system                        engine-image-ei-045573ad-knqc5                                    1/1     Running       0          2d7h   10.42.5.2        ds04.ecs.openstack.com   <none>           <none>
longhorn-system                        instance-manager-e-3cf7ad0b                                       1/1     Terminating   0          2d7h   10.42.5.4        ds04.ecs.openstack.com   <none>           <none>
longhorn-system                        instance-manager-r-bf10b574                                       1/1     Terminating   0          2d7h   10.42.5.5        ds04.ecs.openstack.com   <none>           <none>
longhorn-system                        longhorn-csi-plugin-qxwk6                                         2/2     Running       0          2d7h   10.42.5.10       ds04.ecs.openstack.com   <none>           <none>
longhorn-system                        longhorn-manager-mbs49                                            1/1     Running       0          2d7h   10.42.5.3        ds04.ecs.openstack.com   <none>           <none>
warehouse-default-datalake-default     hue-query-processor-0                                             1/1     Terminating   0          2d6h   10.42.5.44       ds04.ecs.openstack.com   <none>           <none>
warehouse-default-datalake-default     metastore-0                                                       1/1     Terminating   0          148m   10.42.5.56       ds04.ecs.openstack.com   <none>           <none>
- CDW cluster failed with errors “504 Gateway Time-out”.
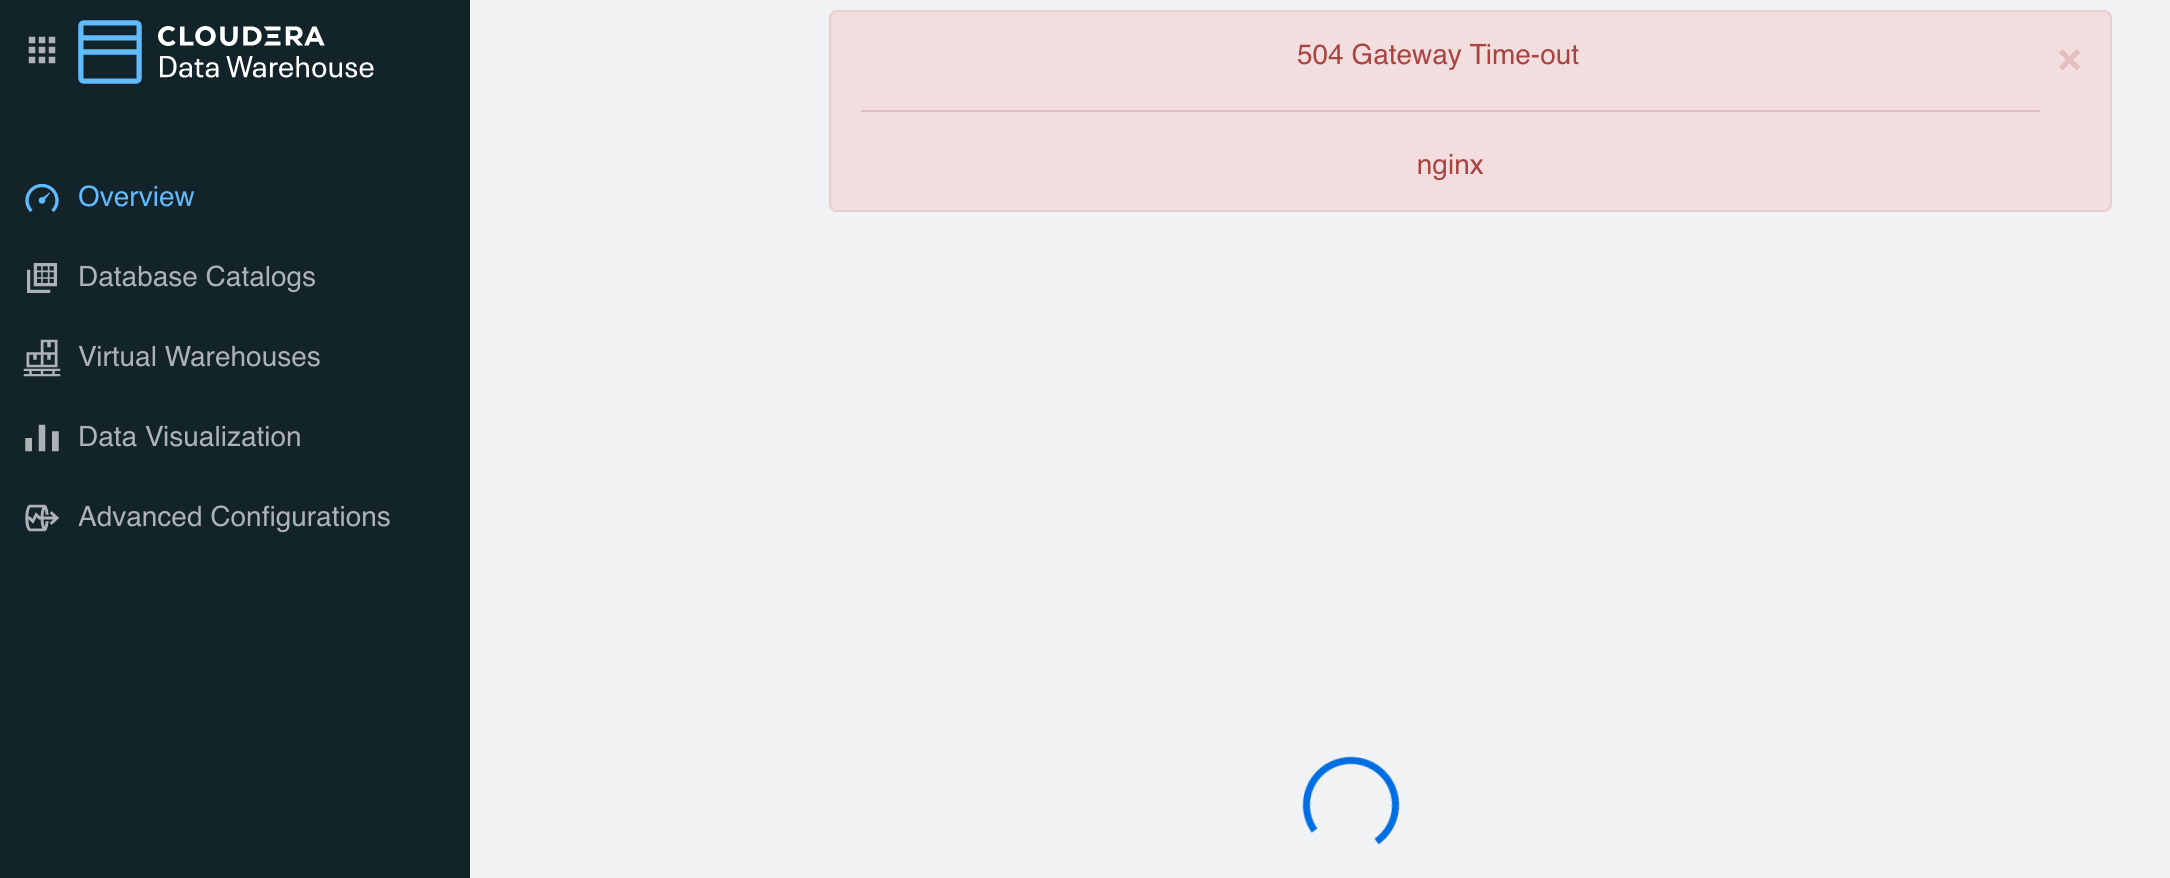
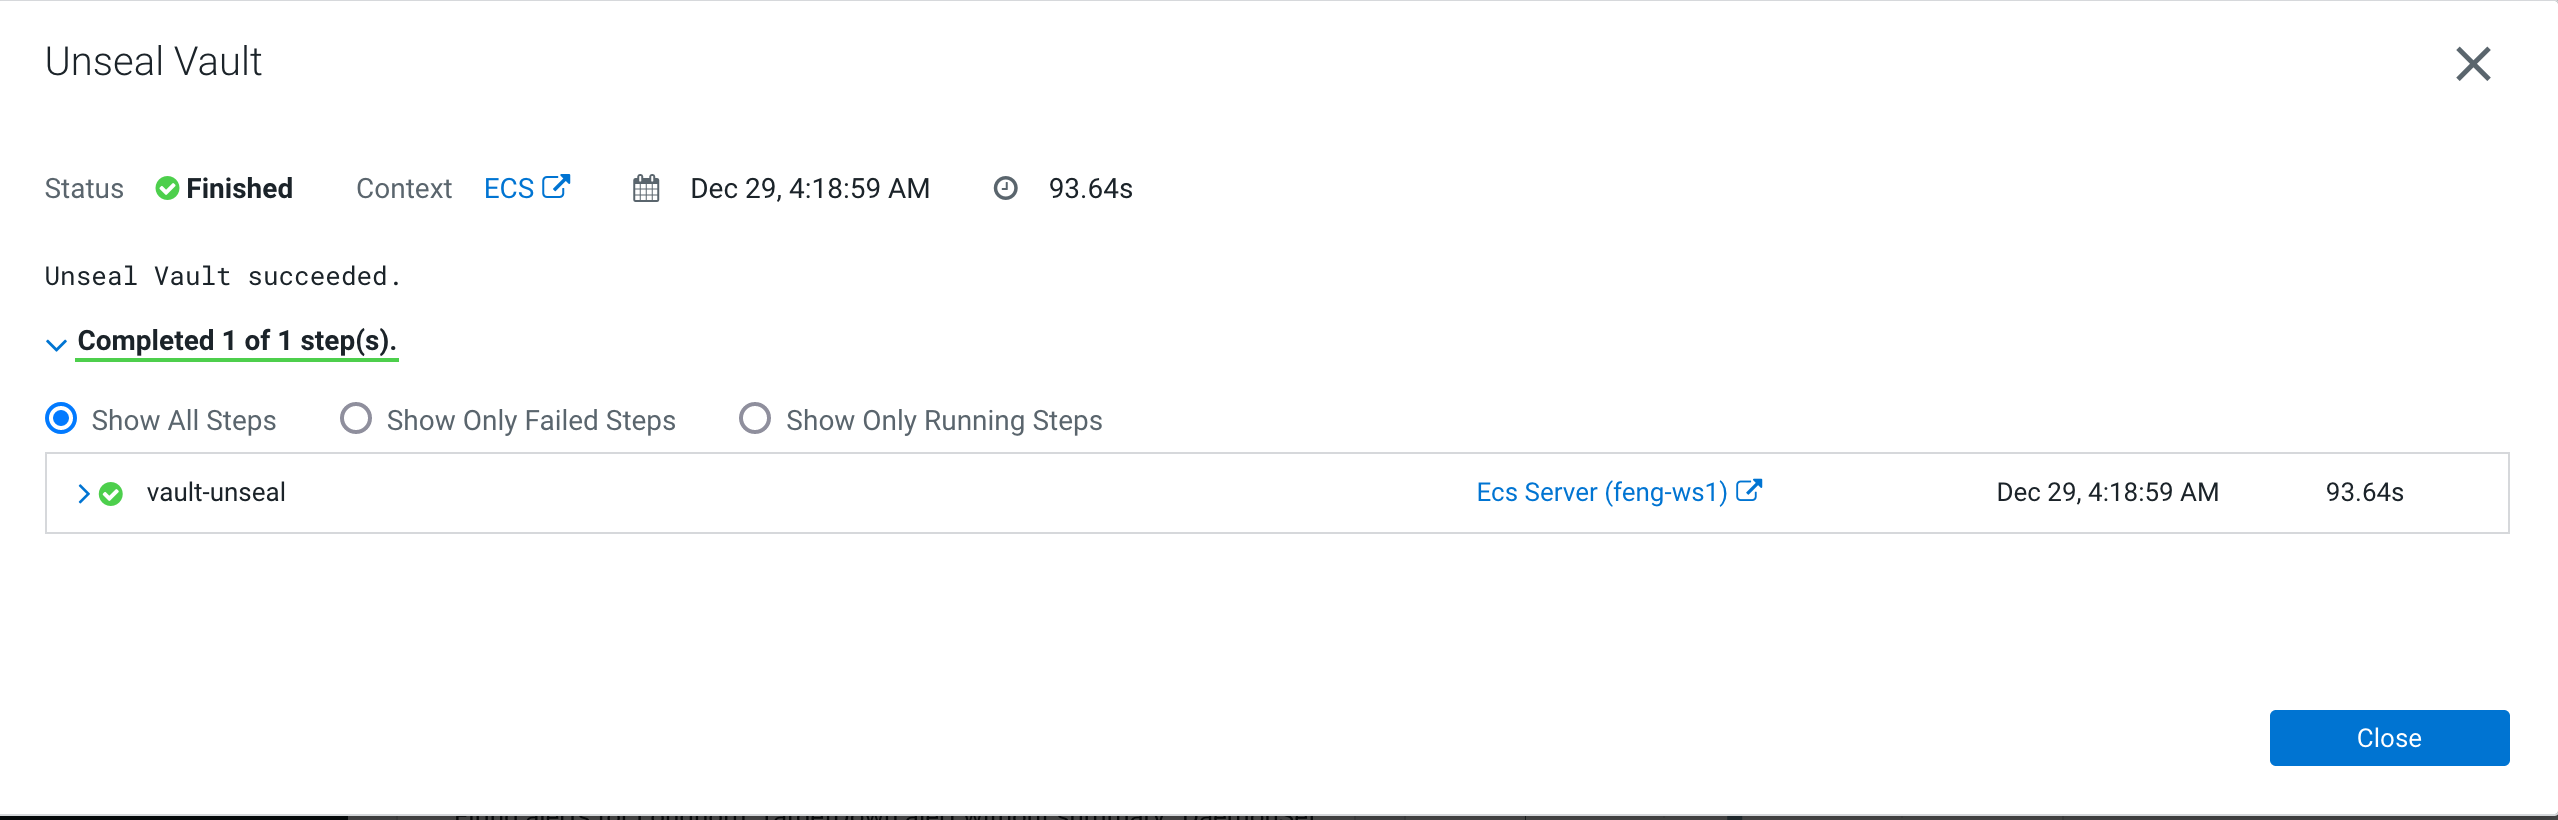
- The root casue is that pod vault-0 automatically was reschedule to ds02 and it’s status is sealed.
$ kubectl get pod vault-0 -n vault-system -o wide
NAME      READY   STATUS    RESTARTS   AGE     IP           NODE                                    NOMINATED NODE   READINESS GATES
vault-0   0/1     Running   0          8m23s   10.42.1.89   ds02.ecs.openstack.com   <none>           <none>

$ curl -k https://vault.localhost.localdomain/v1/sys/seal-status
{"type":"shamir","initialized":true,"sealed":false,"t":1,"n":1,"progress":0,"nonce":"","version":"1.9.0","migration":false,"cluster_name":"vault-cluster-15bfdf25","cluster_id":"f3e2c6f7-cffd-def5-830a-f4bef6522b01","recovery_seal":false,"storage_type":"file"}
- You have to manually unseal vault via CM UI.
- Job pod-reaper forced deleting pods in terminating state after 18 minutes of service interruption.
$ kubectl logs -n pod-reaper pod-reaper-27871940-469b7
Thu Dec 29 12:20:01 UTC 2022 Starting pod-reaper [Reap older than: 10 minute(s)][Namespace regex: *UNKNOWN*]
Thu Dec 29 12:20:01 UTC 2022 processing namespace cdp
Thu Dec 29 12:20:01 UTC 2022 processing namespace compute-hive01
Thu Dec 29 12:20:01 UTC 2022 processing namespace cml01-user-1
Thu Dec 29 12:20:01 UTC 2022 processing namespace cml01
Thu Dec 29 12:20:01 UTC 2022 processing namespace default-ad522d9e-log-router
Thu Dec 29 12:20:01 UTC 2022 processing namespace impala-impala01
Thu Dec 29 12:20:01 UTC 2022 processing namespace infra-prometheus
Thu Dec 29 12:20:01 UTC 2022 processing namespace default-ad522d9e-monitoring-platform
Thu Dec 29 12:20:01 UTC 2022 processing namespace ecs-webhooks
Thu Dec 29 12:20:01 UTC 2022 processing namespace default
Thu Dec 29 12:20:01 UTC 2022 Force delete pod monitoring-logger-alert-receiver-7485d89576-vg6n4 in namespace default-ad522d9e-monitoring-platform with deletion timestamp: 2022-12-29T12:08:11Z
Thu Dec 29 12:20:01 UTC 2022 Force delete pod infra-prometheus-operator-operator-854bdc78b6-2whcf in namespace infra-prometheus with deletion timestamp: 2022-12-29T12:08:11Z
Thu Dec 29 12:20:01 UTC 2022 Force delete pod huebackend-0 in namespace compute-hive01 with deletion timestamp: 2022-12-29T12:08:11Z
warning: Immediate deletion does not wait for confirmation that the running resource has been terminated. The resource may continue to run on the cluster indefinitely.
warning: Immediate deletion does not wait for confirmation that the running resource has been terminated. The resource may continue to run on the cluster indefinitely.
warning: Immediate deletion does not wait for confirmation that the running resource has been terminated. The resource may continue to run on the cluster indefinitely.
pod "monitoring-logger-alert-receiver-7485d89576-vg6n4" force deleted
pod "infra-prometheus-operator-operator-854bdc78b6-2whcf" force deleted
Thu Dec 29 12:20:01 UTC 2022 Successfully force deleted pod monitoring-logger-alert-receiver-7485d89576-vg6n4 in namespace default-ad522d9e-monitoring-platform
Thu Dec 29 12:20:01 UTC 2022 Successfully force deleted pod infra-prometheus-operator-operator-854bdc78b6-2whcf in namespace infra-prometheus
pod "huebackend-0" force deleted
......
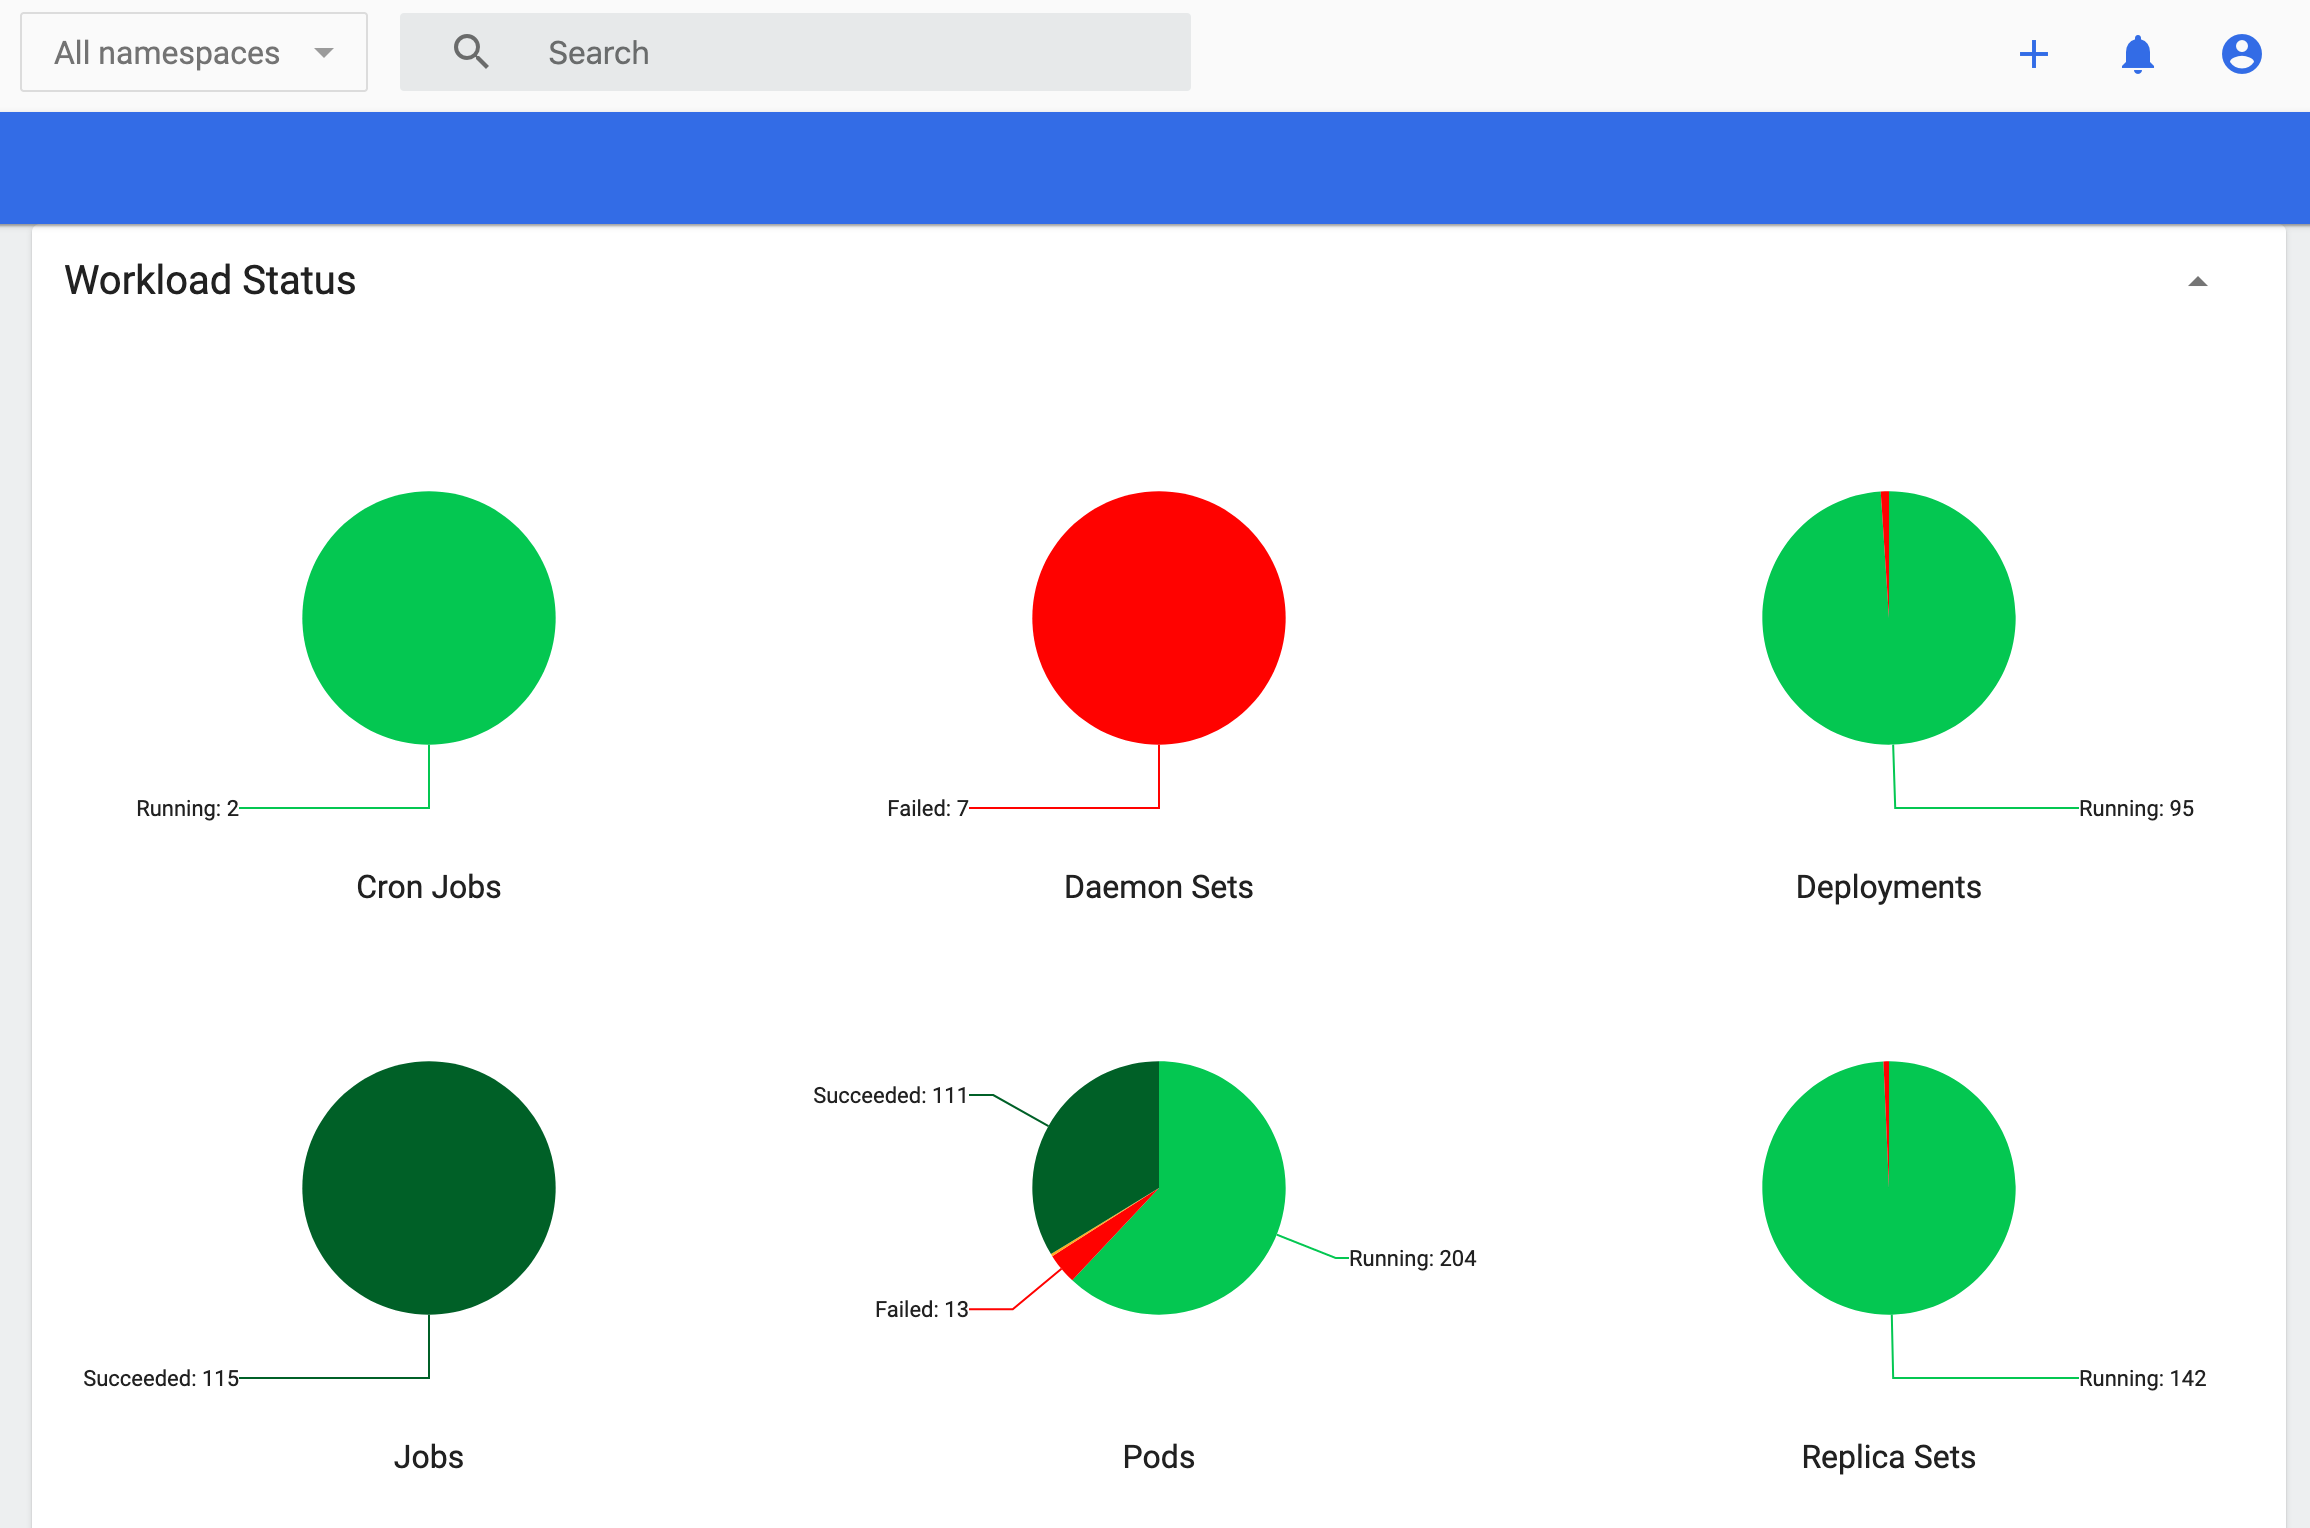
- The remaining 9 pods on ds04 are basically daemonset type. Pod impala-impala01 is an exception.
$ kubectl get pods -A -o wide --field-selector spec.nodeName=ds04.ecs.openstack.com
NAMESPACE          NAME                                                              READY   STATUS        RESTARTS   AGE    IP               NODE                                    NOMINATED NODE   READINESS GATES
cml01              livelog-publisher-989hx                                           2/2     Running       2          2d6h   10.42.5.45       ds04.ecs.openstack.com   <none>           <none>
impala-impala01    impala-executor-000-0                                             1/1     Terminating   0          33h    10.42.5.54       ds04.ecs.openstack.com   <none>           <none>
infra-prometheus   infra-prometheus-operator-1-1672115985-prometheus-node-expzhqf7   1/1     Running       0          2d7h   192.168.8.144   ds04.ecs.openstack.com   <none>           <none>
kube-system        kube-proxy-ds04.ecs.openstack.com                  1/1     Running       0          2d7h   192.168.8.144   ds04.ecs.openstack.com   <none>           <none>
kube-system        nvidia-device-plugin-daemonset-j278f                              1/1     Running       0          2d7h   10.42.5.16       ds04.ecs.openstack.com   <none>           <none>
kube-system        rke2-canal-kmtnv                                                  2/2     Running       0          2d7h   192.168.8.144   ds04.ecs.openstack.com   <none>           <none>
longhorn-system    engine-image-ei-045573ad-knqc5                                    1/1     Running       0          2d7h   10.42.5.2        ds04.ecs.openstack.com   <none>           <none>
longhorn-system    longhorn-csi-plugin-qxwk6                                         2/2     Running       0          2d7h   10.42.5.10       ds04.ecs.openstack.com   <none>           <none>
longhorn-system    longhorn-manager-mbs49                                            1/1     Running       0          2d7h   10.42.5.3        ds04.ecs.openstack.com   <none>           <none>
- We also see the same result on k8s web UI with only 9 failed pods.
- Pod impala-impala01 has attached local storage pvc
scratch-cache-volume-impala-executor-000-0. If you’re using local volumes, and the node crashes, your pod cannot be rescheduled to a different node. It is scheduled to the same node by default. That is the caveat of using local storage, your pod becomes bound forever to one specific node. Both pvc and pod must be forced deleting according to issue 61620.
$ kubectl delete pvc scratch-cache-volume-impala-executor-000-0 -n impala-impala01
persistentvolumeclaim "scratch-cache-volume-impala-executor-000-0" deleted

$ kubectl get pvc scratch-cache-volume-impala-executor-000-0 -n impala-impala01
NAME                                         STATUS        VOLUME                                     CAPACITY   ACCESS MODES   STORAGECLASS   AGE
scratch-cache-volume-impala-executor-000-0   Terminating   pvc-a88fb425-55e5-49b8-b3d5-6b371bb6cb7b   94Gi       RWO            local-path     34h

$ kubectl patch pvc scratch-cache-volume-impala-executor-000-0 -n impala-impala01 -p '{"metadata":{"finalizers":null}}'
persistentvolumeclaim/scratch-cache-volume-impala-executor-000-0 patched

$ kubectl get pvc scratch-cache-volume-impala-executor-000-0 -n impala-impala01
Error from server (NotFound): persistentvolumeclaims "scratch-cache-volume-impala-executor-000-0" not found

$ kubectl delete pod impala-executor-000-0 -n impala-impala01 --grace-period=0 --force
warning: Immediate deletion does not wait for confirmation that the running resource has been terminated. The resource may continue to run on the cluster indefinitely.
pod "impala-executor-000-0" force deleted
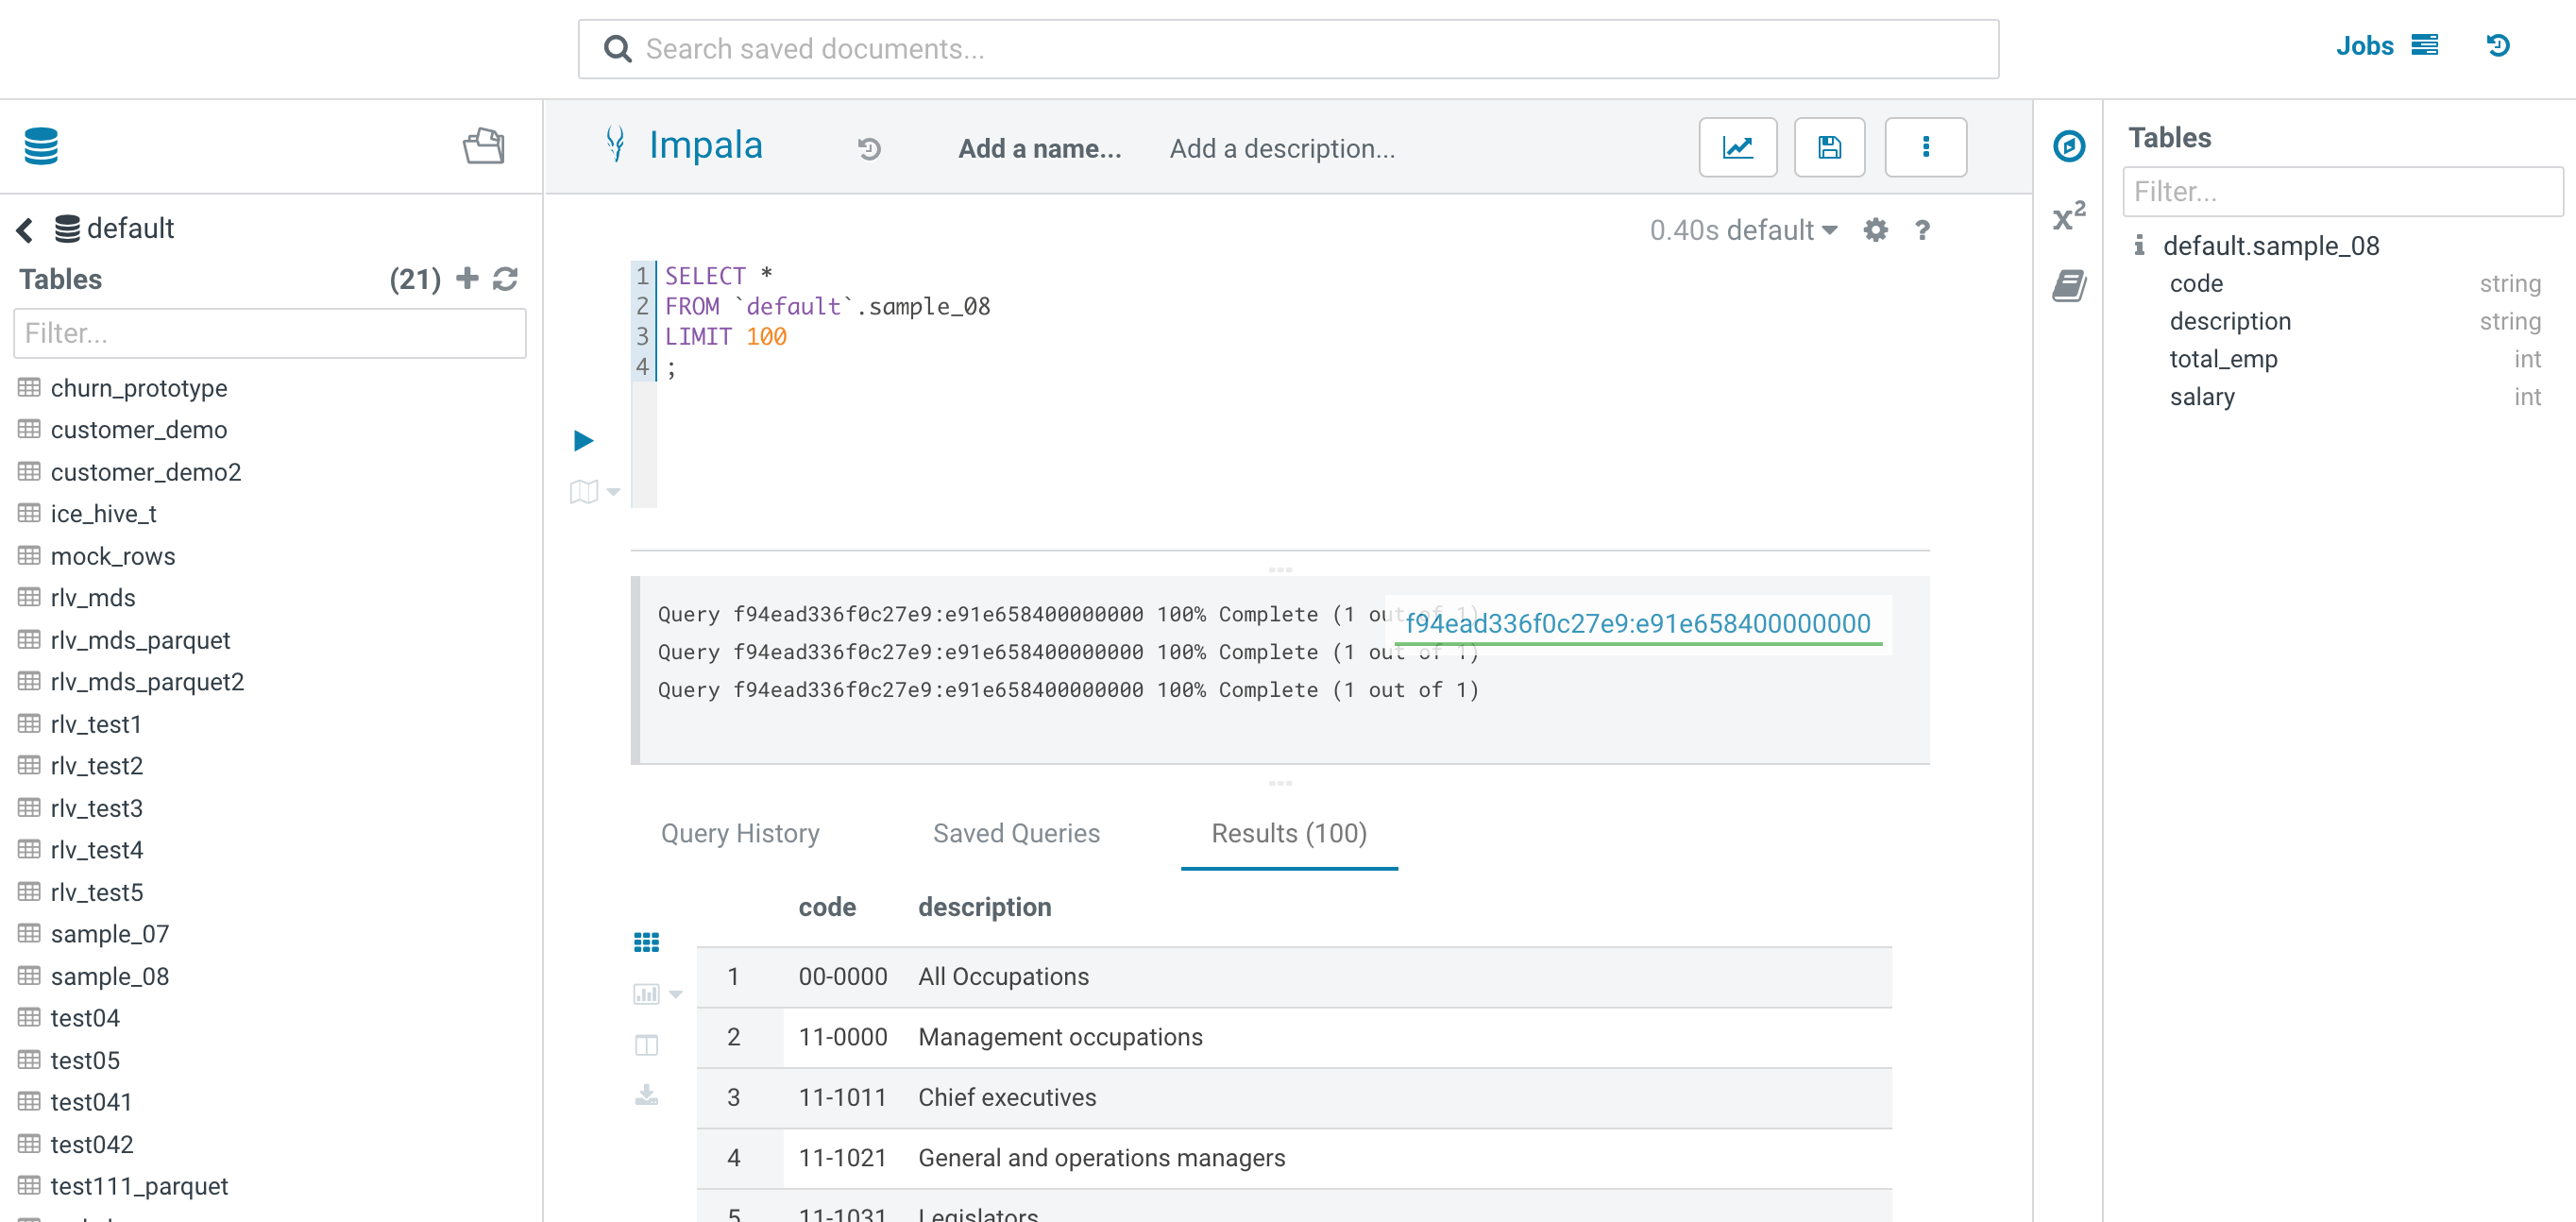
- Confirm that CP/CDW/CML works well
5. Conclusion
- When an ECS node goes down, the workload pods on it will be forcibly deleted by cronjob pod-reaper and rescheduled to other normal nodes. But there are two exceptions that require manual intervention:
- Pod vault-0 can be automatically evicted, but you have to manually unseal vault via CM UI.
- Pods using local-storage (impala-executor/impala-coordinator/query-executor/query-coordinator) cannot be evicted, please manually delete both pvc and pod.
- The maximum service interruption time is 25 minutes after node crash, where:
| No. | Timing Distribution | Default Value | Description |
| 1 | podEviction Timeout | 5min | The Pods running on an unreachable Node enter the ‘Terminating’ or ‘Unknown’ state after podEviction timeout |
| 2 | Cronjob Execution Cycle | 10min | CronJob pod-reaper launched reaper job every 10 minutes |
| 3 | REAP_OLDER_THAN | 10min | The reaper job will scan all namespaces and force deleting pods that have been in the terminating state for more than 10 minutes |